Hi there,
I’m working arround an issue on my NagVis map.
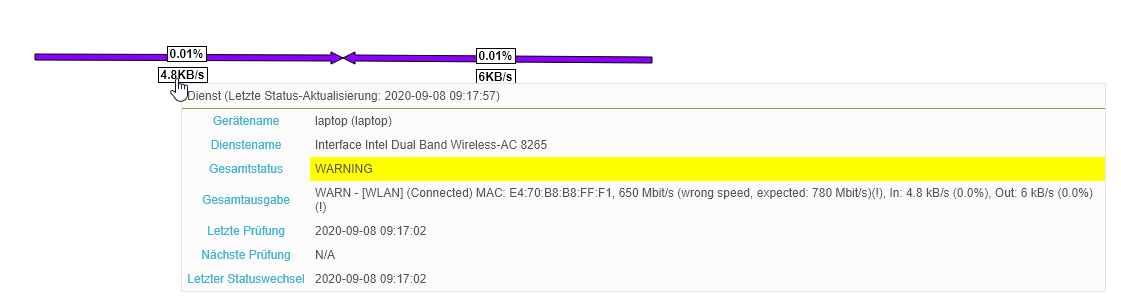
Alternatively, the network interfaces statistics have 0 as value and the check value.
This problem appear on line and host objects.
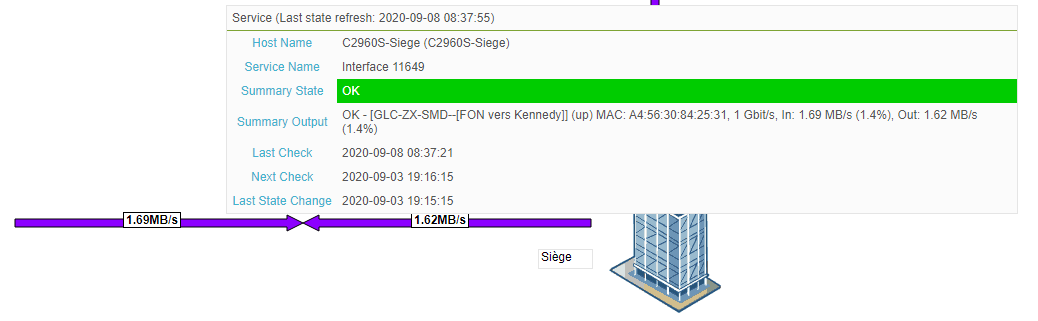
It looks like NagVis is not able to get the checked value while values are present on the services graphs.
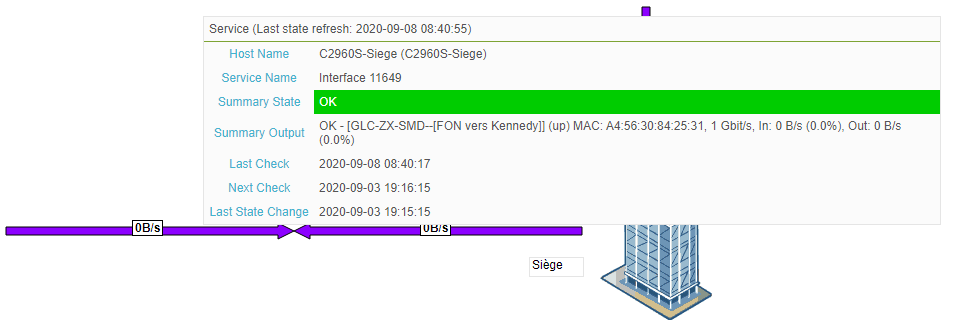
In the second picture you see the “Summary Output” with all zero. This is the same value as it is shown inside CMK. Can you have a look at the output of this check at the same time in CMK?
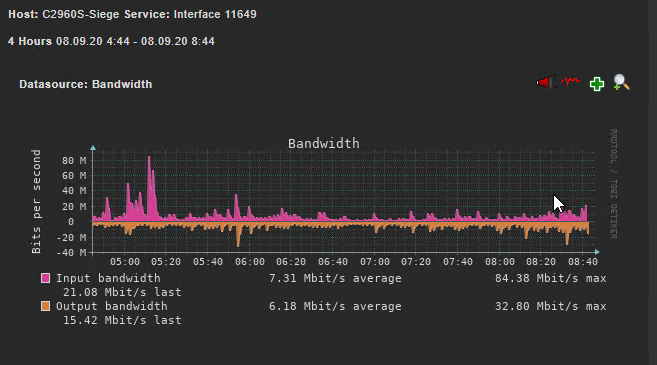
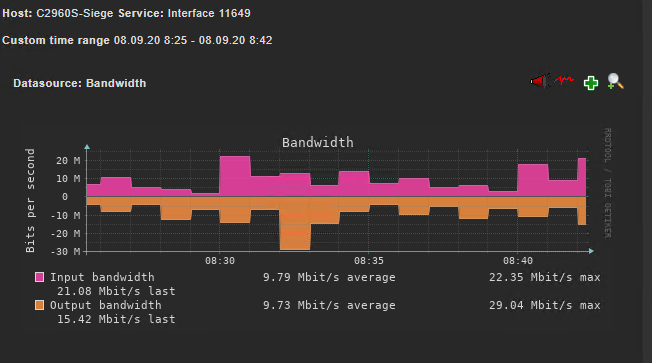
The graph shown in the last screen is then relevant if you zoom in that it is possible to see every minute.
With the actual zoom the graph looks a little bit strange with all the small peaks. If you zoom to the last 10 minutes or so i expect to see every other minute a zero value.
My second screenshot shown the CMK value as zero while you can see on the zoomed screenshhot from graph, the value is upper than.
I don’t understand why NagVis don’t get the CMK value a port of time and the good value the rest of time.
I’ve made another test. I’ve puted the same interface on my Test instance on another server. Then, I’m not abe to reproduce the issue.
The line on NagVis give a value every minutes. By the way, it seems the value in Nagvis are not sames : 3Mbs on NagVis against 30Mbs on graph, like a x10 delta.
So it seems the problem is linked to my Prod instance. I keep searching.