Slowly getting the hang of it now.
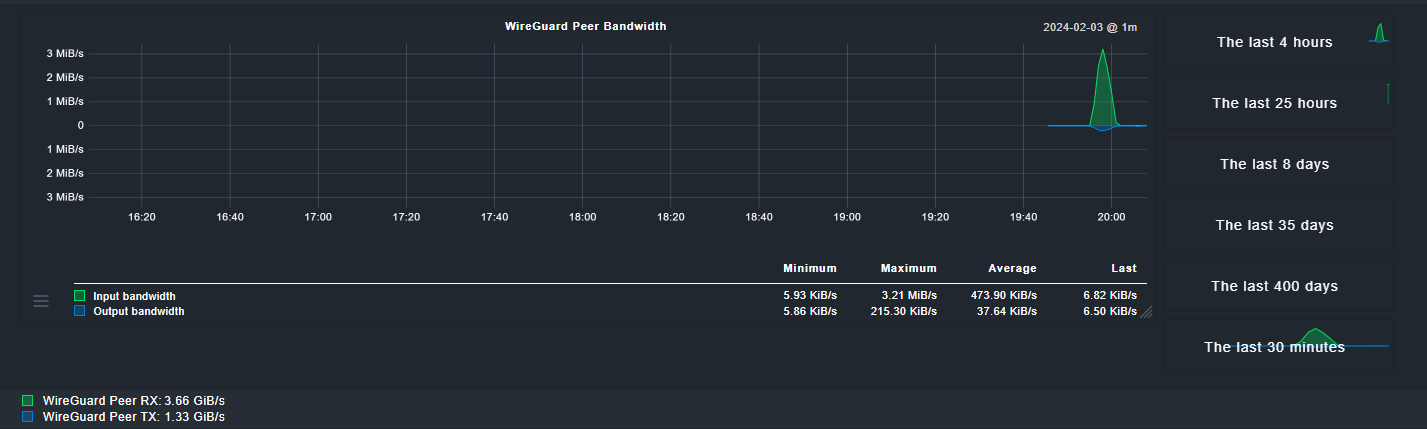
Although I can’t workout were I’m going wrong, if it reports the rx and tx directly from the WireGuard peer, the service graph slows correctly, but the Service Metrics shows incorrectly as it shows total but with per second unit. It always reports in bytes.
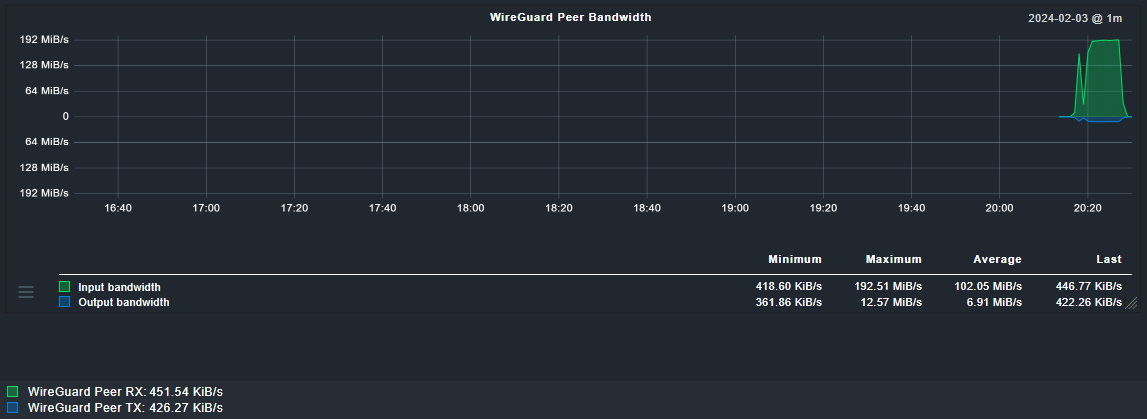
If I set the plugin to only report back the different between each run in the prefdata, then Graph and Service Metrics unit size is way out!. 3-3.5MB/s shows as 192MiB/s.
The graph is showing what happens during a file download and when not downloading.
The script always outputs the metrics in Bytes, so I know the units isn’t changing.
#!/usr/bin/env python3

from cmk.gui.i18n import _
from cmk.gui.plugins.metrics import (metric_info, graph_info, perfometer_info)

metric_info["wgpeerrx"] = {
    "title": _("WireGuard Peer RX"),
    "unit": "bytes/s",
    "color": "#00e060",
}

metric_info["wgpeertx"] = {
    "title": _("WireGuard Peer TX"),
    "unit": "bytes/s",
    "color": "#0080e0",
}

graph_info["wgpeertraffic"] = {
    "title": _("WireGuard Peer Bandwidth"),
    "metrics": [
        ("wgpeerrx", "area", _("Input bandwidth")),
        ("wgpeertx", "-area", _("Output bandwidth")),
    ]
}
nagios check script output
continuous
print(message + f"|wgpeerrx={rx_bytes}c wgpeertx={tx_bytes}c")
difference between last run
print(message + f"|wgpeerrx={rx_bytes_diff} wgpeertx={tx_bytes_diff}")
Any idea where I’m going wrong here?