Looks like the script got removed…here it is again…hope it sticks.
J
nagios_send_host_mail.pl.tar.gz (9.87 KB)
···
From: Jason Humes
Sent: Monday, March 19, 2012 1:38 PM
To: checkmk-en@lists.mathias-kettner.de; omd-users@lists.mathias-kettner.de
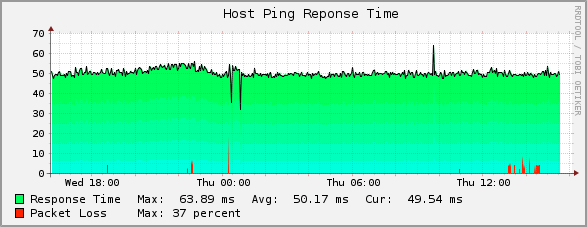
Subject: HTML Host Alert Emails (w encoded ping/loss graph for those with single HOST.rrd files)
Hi
For those who’d like an alert email like the one below, add this command to your notification_commands.cfg;
define command {
command_name notify-host-by-html-email
command_line /usr/bin/nagios_send_host_mail.pl -f graph -u -r $CONTACTEMAIL$
}
and if you dont have single HOST.rrd files (not sure what controls this and why some of my hosts use single files while others have individual _HOST__pl.rrd, etc files…still trying to get this figured out and also if there is any pro/con to single vs multiple
RRD files), just change the -f graph to -f html and you’ll get the HTML email just without the encoded graph.
and drop the attached script into /usr/bin/
You’ll need to open the script and edit a few paths to get the url links working and make sure the path to your pnp cache is set and all should be working 
I’ve also got this for service alerts, but no graph encoding as it’s too much to figure out what the actual alert meaning is and then generate a matching graph. I see newer updates of this script use wget to fetch the actual pnp generated png and then encode
that, but you’d still have to do some grep magic on the event data to figure out if it was, in the example of an interface service, error rates, transfer rates, state alert, etc and then wget the proper pnp png file…still not super easy.
Cheers
J
From: Monitoring Portal [Netmon@monitoring.org]
Sent: Thursday, March 08, 2012 4:04 PM
To: nocalerts
Subject: DOWN - Host AP_CabinetSW5 - PROBLEM
Notification Type:
PROBLEM
Host Status:
DOWN
Host Name:
AP_CabinetSW5
Hostalias:
AP - Alabama - Cabinet Switch #5
IP Address:
10.199.70.24
Hostgroup:
APALABAMA
Event Time:
Thu Mar 8 16:04:19 EST 2012
Event Data:
CRITICAL - 10.10.70.24: rta nan, lost 100%
Generated by Monitoring Portal.