Hi All,
We have checkmk RAW 1.4.0P8 installed in our ennvironment. and we are montioring around 900 hosts.
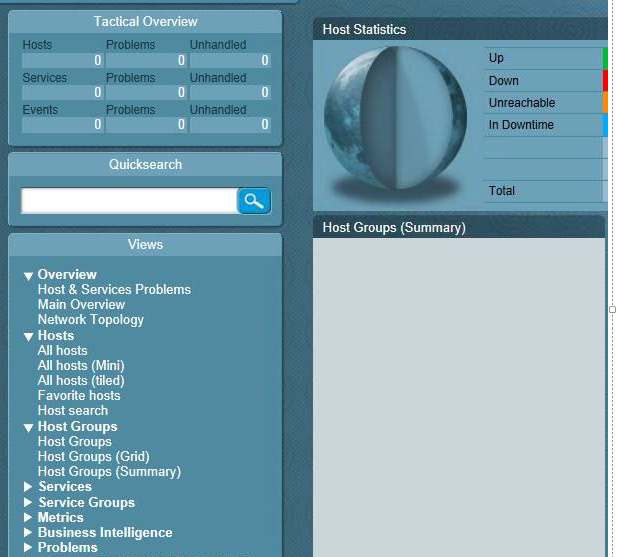
we have seen this issue with our check_mk which is not displaying any data for few minutes and later it is recovered.
I am trying to understand what caused this issue .
I can see below logs in nagios.log
[1589791625] Caught SIGTERM, shutting down…
[1589791625] Successfully shutdown… (PID=5683)
[1589791625] npcdmod: If you don’t like me, I will go out! Bye.
[1589791625] Event broker module ‘/omd/sites/checkmk/lib/npcdmod.o’ deinitialized successfully.
[1589791625] livestatus: deinitializing
[1589791625] livestatus: waiting for main to terminate…
[1589791626] livestatus: waiting for client threads to terminate…
[1589791626] livestatus: could not join thread main
[1589791626] livestatus: main thread + 20 client threads have finished
[1589791626] Event broker module ‘/omd/sites/checkmk/lib/mk-livestatus/livestatus.o’ deinitialized successfully.
[1589791636] Nagios 3.5.0 starting… (PID=13291)
[1589791636] Local time is Mon May 18 09:47:16 BST 2020
[1589791636] LOG VERSION: 2.0
[1589791636] npcdmod: Copyright © 2008-2009 Hendrik Baecker (andurin@process-zero.de) - http://www.pnp4nagios.org
[1589791636] npcdmod: /omd/sites/checkmk/etc/pnp4nagios/npcd.cfg initialized
[1589791636] npcdmod: spool_dir = ‘/omd/sites/checkmk/var/pnp4nagios/spool/’.
[1589791636] npcdmod: perfdata file ‘/omd/sites/checkmk/var/pnp4nagios/perfdata.dump’.
[1589791636] npcdmod: Ready to run to have some fun!
[1589791636] Event broker module ‘/omd/sites/checkmk/lib/npcdmod.o’ initialized successfully.
[1589791636] livestatus: setting number of client threads to 20
[1589791636] livestatus: fl_socket_path=[/omd/sites/checkmk/tmp/run/live], fl_mkeventd_socket_path=[/omd/sites/checkmk/tmp/run/mkeventd/status]
[1589791636] livestatus: Livestatus 1.4.0p8 by Mathias Kettner. Socket: ‘/omd/sites/checkmk/tmp/run/live’
[1589791636] livestatus: Please visit us at http://mathias-kettner.de/
[1589791636] livestatus: running on OMD site checkmk, cool.
[1589791636] livestatus: opened UNIX socket at /omd/sites/checkmk/tmp/run/live
[1589791636] livestatus: your event_broker_options are sufficient for livestatus…
[1589791636] livestatus: finished initialization, further log messages go to /omd/sites/checkmk/var/nagios/livestatus.log
[1589791636] Event broker module ‘/omd/sites/checkmk/lib/mk-livestatus/livestatus.o’ initialized successfully.
[1589791636] Finished daemonizing… (New PID=13292)
[1589791637] livestatus: TIMEPERIOD TRANSITION: 24X7;-1;1
[1589791637] livestatus: TIMEPERIOD TRANSITION: DevOps_HAProxy_Ignore;-1;1
[1589791637] livestatus: TIMEPERIOD TRANSITION: Exclude3am;-1;1
[1589791637] livestatus: TIMEPERIOD TRANSITION: ExcludeMidnight;-1;1
[1589791637] livestatus: TIMEPERIOD TRANSITION: dnp_ignoretimes;-1;1
[1589791637] livestatus: TIMEPERIOD TRANSITION: vasf_ignore;-1;1
[1589791637] livestatus: logging initial states
[1589791637] livestatus: starting main thread and 20 client threads
and this is my icinga livstatus.log
020-05-18 09:47:03 [client 8] Unknown dynamic column ‘rrddata’
2020-05-18 09:47:06 [client 19] error: Client connection terminated while request still incomplete
2020-05-18 09:47:06 [main] socket thread has terminated
2020-05-18 09:47:06 [client 9] error: Client connection terminated while request still incomplete
2020-05-18 09:47:06 [main] flushing log file index
2020-05-18 11:38:52 [client 19] error: Client connection terminated while request still incomplete
2020-05-18 11:38:53 [main] socket thread has terminated
2020-05-18 11:38:53 [client 10] error: Client connection terminated while request still incomplete
2020-05-18 11:38:53 [main] flushing log file index
2020-05-18 11:41:50 [client 17] Unknown dynamic column ‘rrddata’
2020-05-18 11:41:50 [client 16] Unknown dynamic column ‘rrddata’
2020-05-18 11:41:51 [client 1] Unknown dynamic column ‘rrddata’
2020-05-18 11:41:52 [client 19] Unknown dynamic column ‘rrddata’
2020-05-18 11:41:54 [client 6] Unknown dynamic column ‘rrddata’
2020-05-18 11:41:54 [client 7] Unknown dynamic column ‘rrddata’
