I have been using CheckMK and the corresponding CheckMK-Grafana Plugin for visualizing a sort of Network/Host Monitoring. And now i ran into a problem.
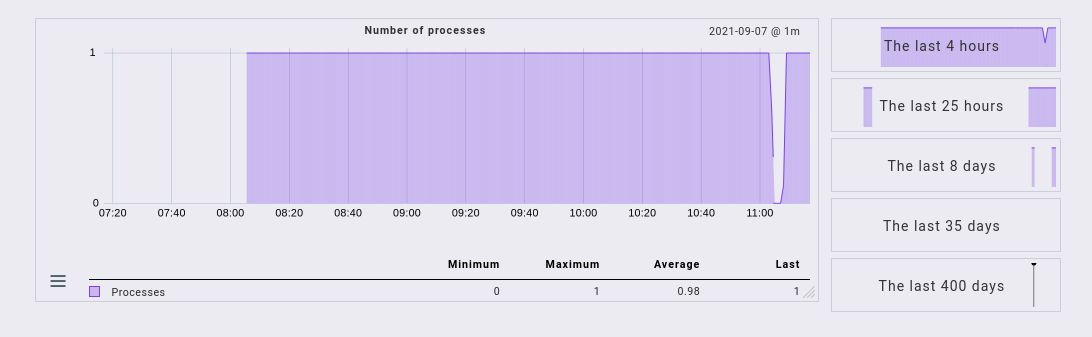
I’ve added the checks for some processes on our Windows Server 2019 machines. While the processes are running everything works as expected and i can visualize the Check in Grafana. (Green for process is running). Once the process is not running, i would assume that the check would go red, since there is no process running but grafana throws an exception that it “cannot read property “meta” of undefined”.
Hi Kai,
did you try to check your processes with “Enforced service” instead of “Process dicovery”. With Enforced service for Processes you may have a valid state.
Cheers, Christian
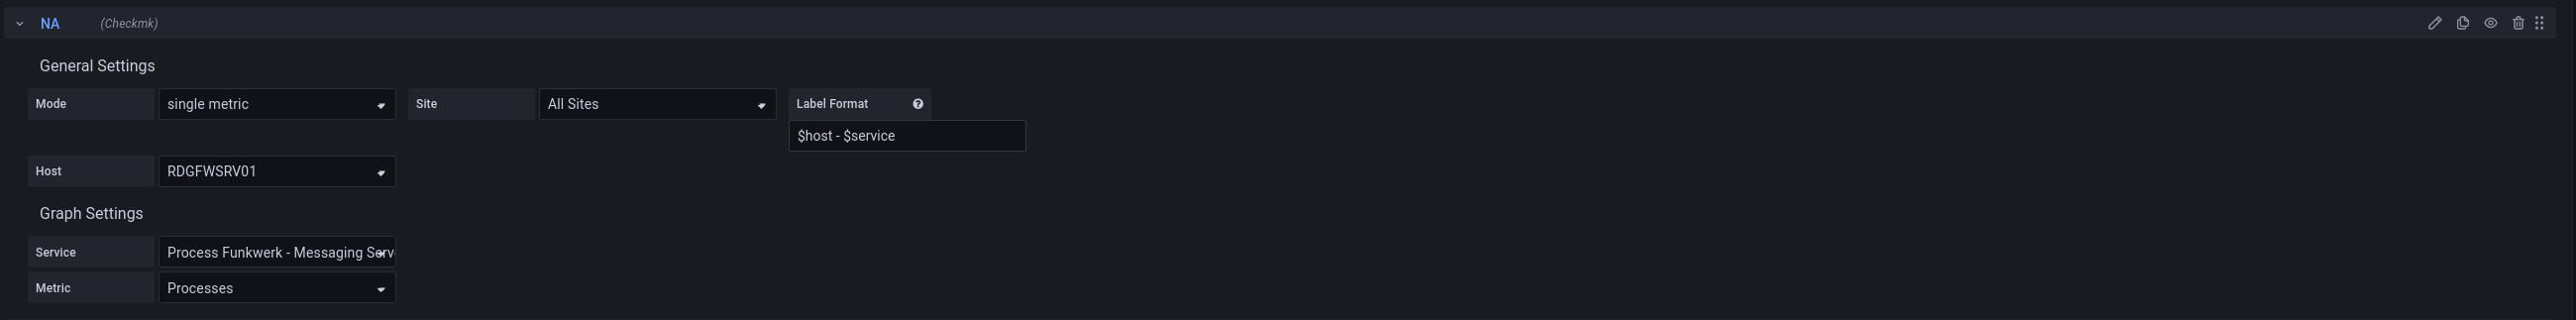
i tried the enforced service and it is working more consistently, but there is still 1 problem.
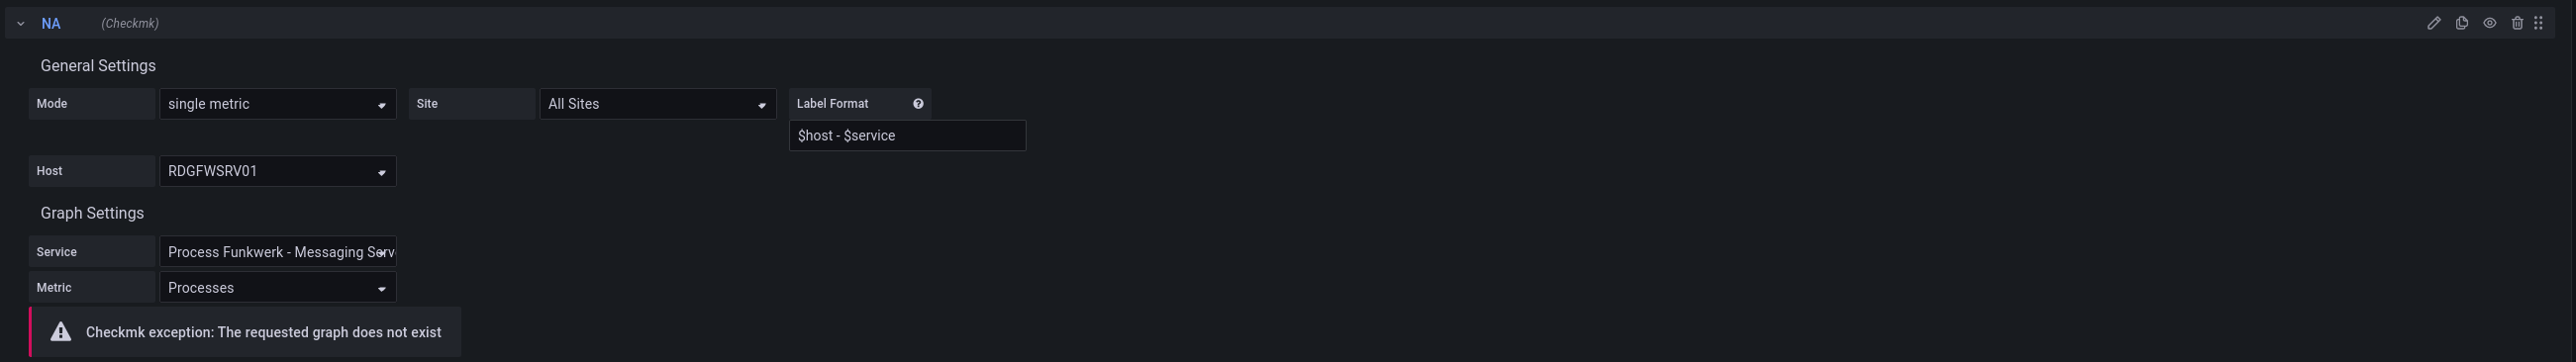
If the process is running and you select the metric within Grafana, the number of processes is at position 5 or so within the possible metrics. If the process is not running there is only 1 metric left and so Grafana can not find the 5th metric within the service and and therefore throws another exception. “e is undefined”.
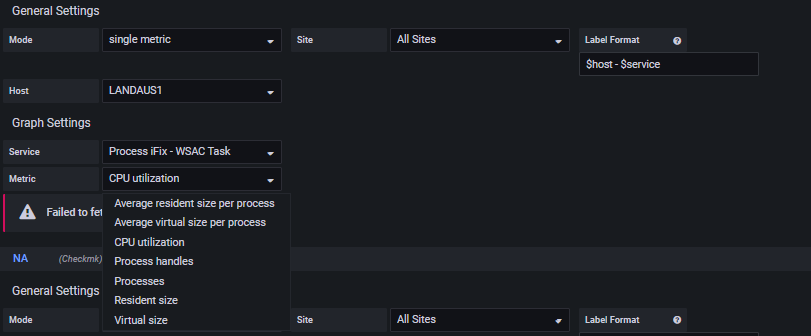
Hopefully since the 1st metric for a running process is cpu utilization this will hopefully be non-zero value. So it is kind of a workaround.
Well, okay, this isn’t really satisfying, since I can’t guarantee that the process is utilizing the cpu all the time, even if it is running. Any other suggestion ?
You are using Grafana to visualize data from your checkmk instance
You have process checks, that measure if a process is running or not
When visualizing the state of those checks everything works as expected when the process is running but you get errors in Grafana when that process is not running
Correct so far?
You probably have the following situation: When the process is running, you get OK. When it is not running you will get an UNKN, as there is no information on the process. That is how this check works. I am not about enforcing the check, that might give you OK and CRIT states.
If this sounds right, mybe you want to try and check the Windows service instead of the process. That way you will always have a defined state.
Apart from that we would need to see your Grafana query on that measurement. Maybe that query is somehow flawed.
Ah okay, now I see. Well I do not know that integration, I am using Checkmk with InfluxDB and Grafana.
You might have found a bug there, but that does not seem too likely to me. Can you try a different Metric? Maybe the plugin has a hard time interpreting the 0.
The only metric that worked for me was the CPU utilization, as explained above. But then I cannot guarantee that the process is actually utilizing the CPU and the Metric becomes a zero again. Which is counterproductive to the visualization that i want to achieve
This topic was automatically closed 365 days after the last reply. New replies are no longer allowed. Contact an admin if you think this should be re-opened.