I’m using CMK 1.6.0p12 and Grafana v7.0.0 and vSphere/ESXi 6.0.
I’ve been asked about IOPs on our vSphere environment and am struggling to find a metric that appears accurate. I’m using the vsphere special agent to collect stats from both vSphere and ESXi.
So here’s a picture of esxtop for one of my hosts showing one VM with CMDS/s in the xx,xxx range (I’m told by our VAR that CMDS/s is IOPS).

If I watch this for a bit, it’s fairly typical. It does bounce down to 4,000 or so, but always in the thousands.
So now to Grafana using metrics gathered from CMK.
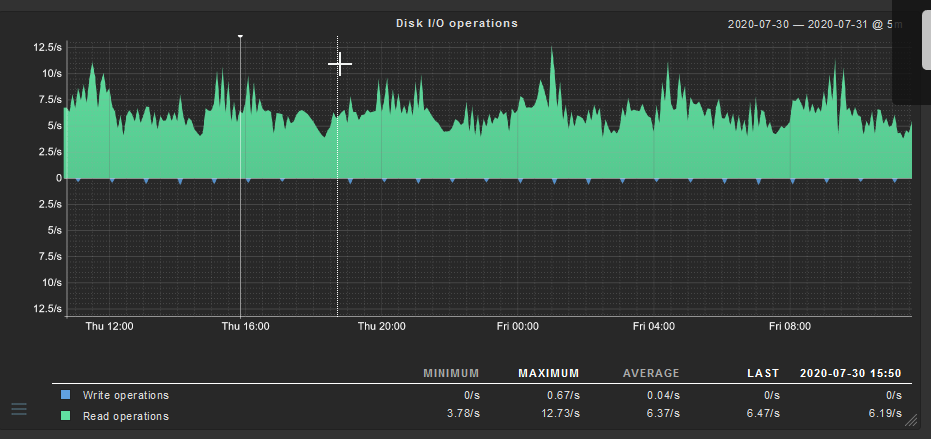
First, Disk_IO_Summary disk_read_ios and disk_write_ios:

Less than 10!?
Also, the built-in CMK graphs show similar numbers:
So then I thought maybe Datastore_IO_Summary… but it’s crazy the other direction! (and sporadic)

Is anyone successfully graphing IOPS for vSphere/ESXi? If so, what metric are you using?
thanks