I have a check that grabs winperf counters. I know I can use get_rate and time to plot the total in the counter as a per second value. But at least in 1.6.0p14 CEE, when the host is down, my total whatever per sec becomes a constant… I’m using get_rate.
Is there a check I can look at that shows me what I should to do handle this properly?
If i understand it correctly you mean your get_rate from the check comes back with a constant value.
But is the check really executed if your host is down? It should normally goes stale as the “Check_MK” service will not be executed if your host is down as there is some type of connection problem then.
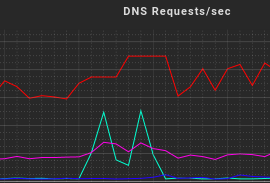
Correct, host was rebooting, so it was down, but rather than a gap or zero, we continued to get a value. In the image, the red line is the graph of the host that is down (rebooting). The aqua shows the host picking up the DNS requests because of the host being down.
def inventory_winperf_skopos_dns(info):
    if len(info) > 1:
        return [(None, {})]


def check_winperf_skopos_dns(_unused, params, info):
    if not info or len(info) == 1:
        return 3, "Performance counters not available"

    this_time = int(time.time())
    total = int(info[1][1])

    state = 0
    state_txt = []
    for val, key, title in [(total, 'total', 'Total Requests')]:
        txt = '%d %s' % (val, title)
        if key in params:
            if val > params[key][0]:
                state = 2
                txt += '(!!)'
            elif val > params[key][1]:
                state = max(state, 1)
                txt += '(!)'
        state_txt.append(txt)

    total_rate=get_rate("dns_requests", this_time, total)

    perfdata = [('total', total_rate)]
    return 0, ", ".join(state_txt), perfdata


check_info["winperf_skopos_dns"] = {
    'check_function': check_winperf_skopos_dns,
    'inventory_function': inventory_winperf_skopos_dns,
    'service_description': 'DNS Requests',
    'has_perfdata': True,
    'group': 'winperf_skopos_dns',
}
So, we’re looking into this more. It’s possible that we created a scenario rule wise where our Windows boxes don’t seem down on a reboot. Which might explain things.
The graph is not showing gaps or zeros as your host must be longer down than the heartbeat of your RRD file to make a gap.
From RRD documentation:
heartbeat defines the maximum number of seconds that may pass between two updates of this data source before the value of the data source is assumed to be UNKNOWN .
In a default environment this setting is something linke 2,4 hours. That means you will see only a gap if more than 2,4 hours your machine is down.