Hello Everyone,
Used Version: check_mk_raw 1.5.0p21
OS: Debian 10 Buster
I am having some problems getting my own check to work.
I have used the following sites to write my check:
(my check is only server side as the check_mk_agent already gives all the information I need)
https://www.steinkogler.org/2016/08/21/check-mk-write-your-own-check/
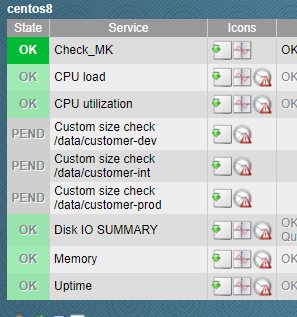
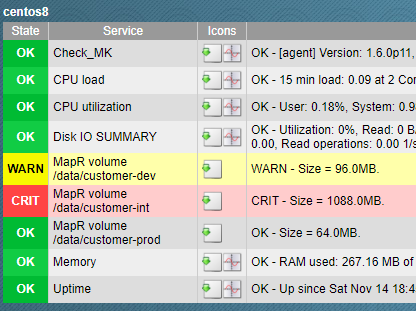
The inventory function works fine, as I can add the service via the website:

The check function also works fine, but only in the Terminal with ‘cmk -nv testhost’:
Check_MK version 1.5.0p21
+ FETCHING DATA
 [agent] Execute data source
 [piggyback] Execute data source
CPU utilization      OK - 0.0% used, user perc: 3.7 %, privileged perc: 3.5 %, 12 CPUs
Disk IO SUMMARY      OK - Read: 0.00 B/s, Write: 0.00 B/s, Average Read Wait: 0.00 ms, Average Write Wait: 0.00 ms, Average Read Queue Length: 0.00, Average Write Queue Length: 0.00
Filesystem C:/       OK - 25.1% used (24.41 of 97.43 GB), trend: +7.93 MB / 24 hours
Filesystem D:/       OK - 0.314% used (2.62 of 832.73 GB), trend: 0.00 B / 24 hours
Filesystem E:/       OK - 89.9% used (16.35 of 18.18 TB), trend: -14.15 GB / 24 hours
Filesystem F:/       OK - 0.0% used (0.00 B of 1.97 MB), trend: 0.00 B / 24 hours
Interface 1          OK - [Intel[R] I350 Gigabit Network Connection] (Connected) 1 Gbit/s, in: 23.53 MB/s(19.7%), out: 902.37 kB/s(0.7%)
Memory and pagefile  OK - Memory usage: 62.6% (4.99 GB/7.97 GB), Commit charge: 14.7% (2.35 GB/15.95 GB)
Posa Processes       OK - 23 - All Processes running 15265.1 MB virtual 2259.8 MB physical
Processor Queue      OK - 15 min load 0.00 at 12 Cores (0.00 per Core)
Services Summary     OK - 128 services, 49 services in autostart - of which 4 services are stopped (Emulex_HBA_Management, hcmagent, sppsvc, upnphost), 0 services stopped but ignored
System Time          OK - Offset is 0 sec (warn/crit at 30/60 sec)
Uptime               OK - Up since Wed Feb 27 13:37:15 2019 (358d 18:37:25)
OK - [agent] Version: 1.5.0p21, OS: windows, execution time 0.2 sec | execution_time=0.210 user_time=0.030 system_time=0.000 children_user_time=0.000 children_system_time=0.000 cmk_time_agent=0.178
For some reason the check never returns any output in the webui and always stays pending:
PEND [Posa Processes]
There should have been a screenshot here but I can only upload one, as I am new here.
Now I think there is a problem with check_mk getting the plugin-output to nagios, as nagios doesn’t recive any plugin-output:
# nagios.log
[1582239600] CURRENT SERVICE STATE: testhost;Check_MK;OK;HARD;1;OK - [agent] Version: 1.5.0p21, OS: windows, execution time 0.4 sec
[1582239600] CURRENT SERVICE STATE: testhost;Check_MK Discovery;UNKNOWN;HARD;1;(null)
[1582239600] CURRENT SERVICE STATE: testhost;Disk IO SUMMARY;OK;HARD;1;OK - Read: 0.00 B/s, Write: 0.00 B/s, Average Read Wait: 0.00 ms, Average Write Wait: 0.00 ms, Average Read Queue Length: 0.00, Average Write Queue Length: 0.00
[1582239600] CURRENT SERVICE STATE: testhost;Filesystem C:/;OK;HARD;1;OK - 29.6% used (23.09 of 78.12 GB), trend: +1.20 MB / 24 hours
[1582239600] CURRENT SERVICE STATE: testhost;Filesystem D:/;OK;HARD;1;OK - 1.18% used (4.56 of 386.50 GB), trend: 0.00 B / 24 hours
[1582239600] CURRENT SERVICE STATE: testhost;Filesystem E:/;OK;HARD;1;OK - 0.0% used (0.00 B of 1.97 MB), trend: 0.00 B / 24 hours
[1582239600] CURRENT SERVICE STATE: testhost;Interface 1;OK;HARD;1;OK - [Intel[R] 82574L Gigabit Network Connection] (Connected) 1 Gbit/s, in: 2.85 MB/s(2.4%), out: 1.99 kB/s(0.0%)
[1582239600] CURRENT SERVICE STATE: testhost;Memory and pagefile;OK;HARD;1;OK - Memory usage: 31.7% (2.54 GB/7.99 GB), Commit charge: 16.6% (2.65 GB/15.98 GB)
[1582239600] CURRENT SERVICE STATE: testhost;Posa Processes;OK;HARD;1;
[1582239600] CURRENT SERVICE STATE: testhost;Processor Queue;OK;HARD;1;OK - 15 min load 0.08 at 8 Cores (0.01 per Core)
[1582239600] CURRENT SERVICE STATE: testhost;Services Summary;OK;HARD;1;OK - 127 services, 45 services in autostart - of which 2 services are stopped (sppsvc, upnphost), 0 services stopped but ignored
[1582239600] CURRENT SERVICE STATE: testhost;System Time;OK;HARD;1;OK - Offset is 0 sec (warn/crit at 30/60 sec)
[1582239600] CURRENT SERVICE STATE: testhost;Uptime;OK;HARD;1;OK - Up since Tue Oct 30 14:30:43 2018 (478d 09:28:28)
Also here is the check declarations:
# declare the check to Checkmk
check_info["ps.posa"] = {
    'check_function'          :  check_ps_posa,
    'inventory_function'      :  inventory_ps_posa,
    'service_description'     : 'Posa',
    "node_info"               : True, # add first column with actual host name
    "has_perfdata"            : True,
    "group"                   : "posa",
}
And here is the raw output my check function returns to cmk:
(0, '15 - All Processes running 8814.3 MB virtual 1132.3 MB physical', [('vsz', 9025796, '', ''), ('rss', 1159472, '', '')])
I can only guess that my format for my check output is somewhat wrong.
Any help would be great. 
Thanks in advance.