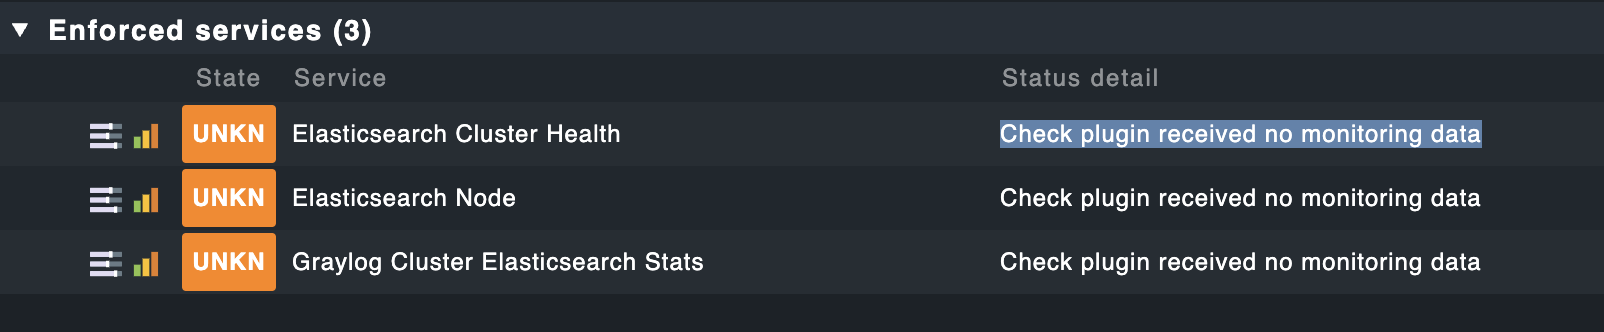
Hello, maybe someone can help me understand why the check plugin received no monitoring data
Hi,
Did you setup the hosts under " Setup → Agents ->Other integrations → Elasticsearch? You do need to setup stuff like hostnames, port to use etc.
If you’ve done that make sure your CheckMK host can connect to your ES server using the information you provided.
Beside the points mentioned by @louis you should also remove the “Enforced service” rules. These rules don’t do anything without the proper datasource configuration.
If the datasource works as @louis wrote, then you will see the checks automatically.
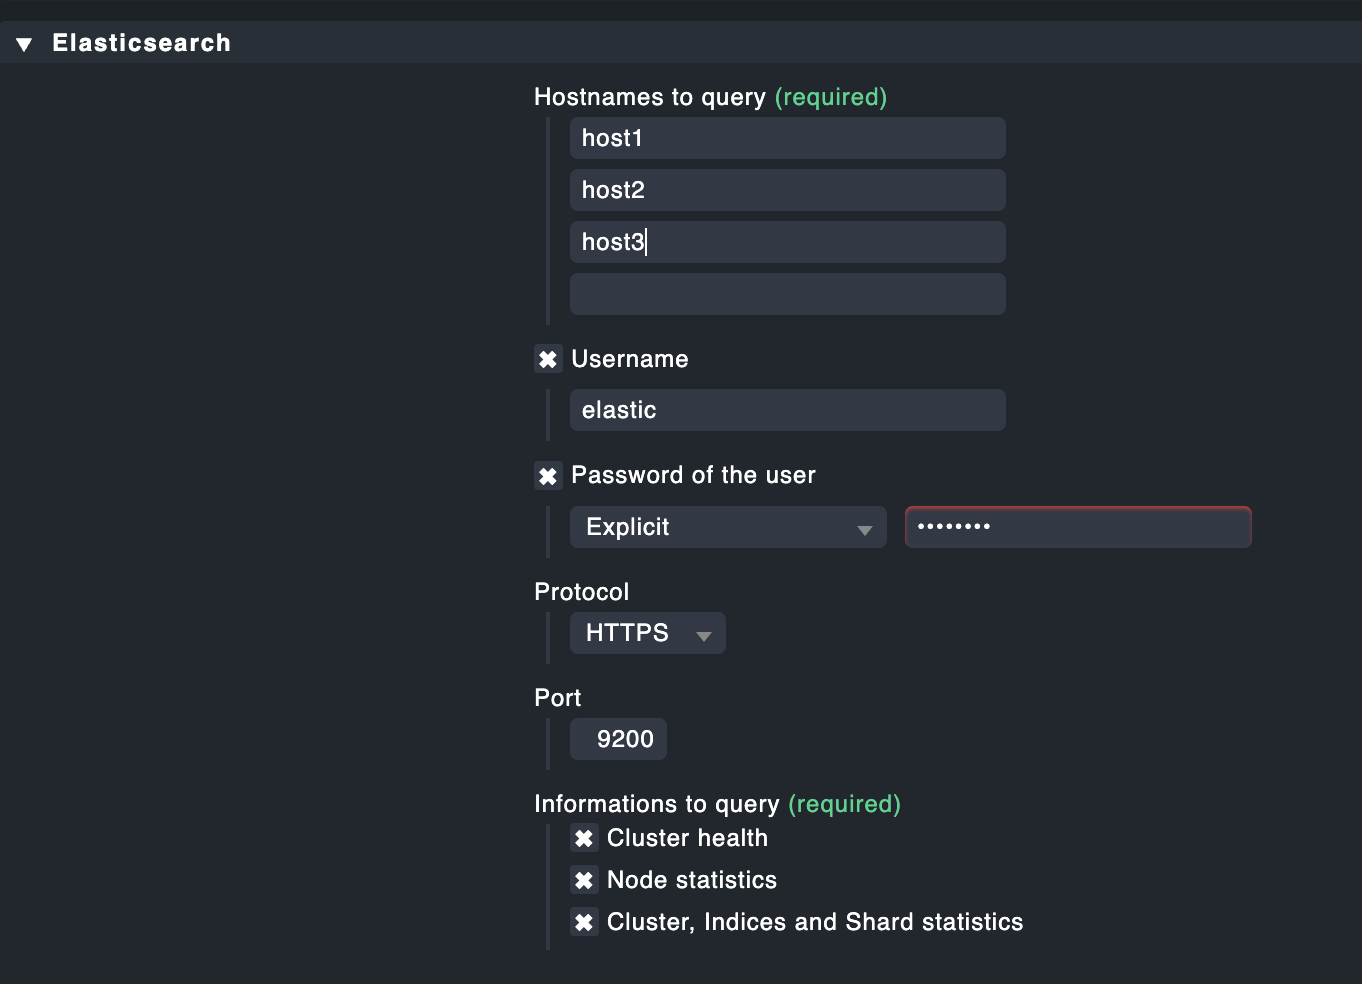
this is what it looks like
cmk -D host1
host1
Tags: [address_family:ip-v4-only], [agent:all-agents], [checkmk-agent:checkmk-agent], [criticality:prod], [ip-v4:ip-v4], [networking:lan], [piggyback:auto-piggyback], [site:it], [snmp_ds:no-snmp], [tcp:tcp]
Labels: [cmk/check_mk_server:yes], [cmk/device_type:vm], [cmk/os_family:linux], [cmk/site:it], [function:elasticsearch]
Host groups: check_mk
Contact groups: all, check-mk-notify
Agent mode: Normal Checkmk agent, all configured special agents
Type of agent:
Program: /omd/sites/it/local/share/check_mk/agents/special/agent_elasticsearch ‘-P’ ‘https’ ‘-m’ ‘cluster_health nodes stats’ ‘-u’ ‘elastic’ ‘-s’ ‘*****’ ‘-p’ ‘9200’ ‘host1’ ‘host2’ ‘host3’
Program: /omd/sites/it/share/check_mk/agents/special/agent_graylog ‘-P’ ‘http’ ‘-m’ ‘alerts,cluster_stats,cluster_traffic,failures,jvm,license,messages,nodes,sidecars,sources,streams’ ‘-t’ 1800 ‘-u’ ‘elastic’ ‘-s’ ‘host1’ ‘–display_node_details’ ‘host’ ‘–display_sidecar_details’ ‘host’ ‘–display_source_details’ ‘host’ ‘-p’ 9200 ‘host1’
Process piggyback data from /omd/sites/it/tmp/check_mk/piggyback/host1
Services:
checktype item params description groups
cpu_loads None Timespecific parameters at 2023-01-25 12:03:57: {‘levels’: (5.0, 10.0)} CPU load
kernel_util None Timespecific parameters at 2023-01-25 12:03:57: {} CPU utilization
checkmk_agent None Timespecific parameters at 2023-01-25 12:03:57: {‘agent_version’: (‘ignore’, {}), ‘agent_version_missmatch’: 1, ‘restricted_address_mismatch’: 1, ‘legacy_pull_mode’: 1} Check_MK Agent
diskstat SUMMARY Timespecific parameters at 2023-01-25 12:03:57: {} Disk IO SUMMARY
elasticsearch_cluster_health None Timespecific parameters at 2023-01-25 12:03:57: {‘green’: 0, ‘yellow’: 1, ‘red’: 2, ‘number_of_nodes’: (2, 1)} Elasticsearch Cluster Health
df / Timespecific parameters at 2023-01-25 12:03:57: {‘levels’: (80.0, 90.0), ‘magic_normsize’: 20, ‘levels_low’: (50.0, 60.0), ‘trend_range’: 24, ‘trend_perfdata’: True, ‘show_levels’: ‘onmagic’, ‘inodes_levels’: (10.0, 5.0), ‘show_inodes’: ‘onlow’, ‘show_reserved’: False, ‘item_appearance’: ‘mountpoint’} Filesystem /
graylog_cluster_stats_elastic None Timespecific parameters at 2023-01-25 12:03:57: {‘green’: 0, ‘yellow’: 1, ‘red’: 2, ‘number_of_nodes_lower’: (2, 1)} Graylog Cluster Elasticsearch Stats
lnx_if 2 Timespecific parameters at 2023-01-25 12:03:57: {‘errors’: {‘both’: (‘perc’, (0.01, 0.1))}, ‘discovered_oper_status’: [‘1’], ‘discovered_speed’: 0} Interface 2
kernel_performance None Timespecific parameters at 2023-01-25 12:03:57: {} Kernel Performance
mem_linux None Timespecific parameters at 2023-01-25 12:03:57: {‘levels_virtual’: (‘perc_used’, (80.0, 90.0)), ‘levels_total’: (‘perc_used’, (120.0, 150.0)), ‘levels_shm’: (‘perc_used’, (20.0, 30.0)), ‘levels_pagetables’: (‘perc_used’, (8.0, 16.0)), ‘levels_committed’: (‘perc_used’, (100.0, 150.0)), ‘levels_commitlimit’: (‘perc_free’, (20.0, 10.0)), ‘levels_vmalloc’: (‘abs_free’, (52428800, 31457280)), ‘levels_hardwarecorrupted’: (‘abs_used’, (1, 1))} Memory
mounts / Timespecific parameters at 2023-01-25 12:03:57: [‘relatime’, ‘rw’] Mount options of /
ntp_time None Timespecific parameters at 2023-01-25 12:03:57: {‘ntp_levels’: (10, 200.0, 500.0), ‘alert_delay’: (300, 3600)} NTP Time
cpu_threads None Timespecific parameters at 2023-01-25 12:03:57: {‘levels’: (‘levels’, (2000, 4000))} Number of threads
systemd_units_services_summary Summary Timespecific parameters at 2023-01-25 12:03:57: {‘ignored’: [‘apt-daily’, ‘apt-daily-upgrade’, ‘apt-daily-update’], ‘states’: {‘active’: 0, ‘inactive’: 0, ‘failed’: 2}, ‘states_default’: 2, ‘activating_levels’: None, ‘deactivating_levels’: (30, 60), ‘reloading_levels’: (30, 60)} Systemd Service Summary
tcp_conn_stats None Timespecific parameters at 2023-01-25 12:03:57: {} TCP Connections
uptime None Timespecific parameters at 2023-01-25 12:03:57: {}
This topic was automatically closed 365 days after the last reply. New replies are no longer allowed. Contact an admin if you think this should be re-opened.