CMK version: CheckMK Enterprise Edition 2.1.0
OS version: Ubuntu 20.04 LTS
Error message:
WARNING: ERROR: Duplicate service description (auto check) 'CPU utilization' for host 'modata'!
 - 1st occurrence: check plugin / item: cpu_utilization_os / None
 - 2nd occurrence: check plugin / item: kernel_util / None
Output of “cmk --debug -vvn hostname”: (If it is a problem with checks or plugins)
OMD[mysite]:~$ cmk --debug -vvn modata
Checkmk version 2.1.0
Try license usage history update.
Trying to acquire lock on /omd/sites/mysite/var/check_mk/license_usage/next_run
Got lock on /omd/sites/mysite/var/check_mk/license_usage/next_run
Trying to acquire lock on /omd/sites/mysite/var/check_mk/license_usage/history.json
Got lock on /omd/sites/mysite/var/check_mk/license_usage/history.json
Next run time has not been reached yet. Abort.
Releasing lock on /omd/sites/mysite/var/check_mk/license_usage/history.json
Released lock on /omd/sites/mysite/var/check_mk/license_usage/history.json
Releasing lock on /omd/sites/mysite/var/check_mk/license_usage/next_run
Released lock on /omd/sites/mysite/var/check_mk/license_usage/next_run
+ FETCHING DATA
  Source: SourceType.HOST/FetcherType.TCP
[cpu_tracking] Start [7fd284379fd0]
[TCPFetcher] Fetch with cache settings: DefaultAgentFileCache(modata, base_path=/omd/sites/mysite/tmp/check_mk/cache, max_age=MaxAge(checking=0, discovery=120, inventory=120), disabled=False, use_outdated=False, simulation=False)
Not using cache (Too old. Age is 3 sec, allowed is 0 sec)
[TCPFetcher] Execute data source
Connecting via TCP to 172.16.14.25:6556 (5.0s timeout)
Detected transport protocol: TransportProtocol.TLS (b'16')
Reading data from agent via TLS socket
Reading data from agent
Detected transport protocol: TransportProtocol.PLAIN (b'<<')
Write data to cache file /omd/sites/mysite/tmp/check_mk/cache/modata
Trying to acquire lock on /omd/sites/mysite/tmp/check_mk/cache/modata
Got lock on /omd/sites/mysite/tmp/check_mk/cache/modata
Releasing lock on /omd/sites/mysite/tmp/check_mk/cache/modata
Released lock on /omd/sites/mysite/tmp/check_mk/cache/modata
Closing TCP connection to 172.16.14.25:6556
[cpu_tracking] Stop [7fd284379fd0 - Snapshot(process=posix.times_result(user=0.009999999999999787, system=0.010000000000000009, children_user=0.0, children_system=0.0, elapsed=2.5700000002980232))]
  Source: SourceType.HOST/FetcherType.PIGGYBACK
[cpu_tracking] Start [7fd284379eb0]
[PiggybackFetcher] Fetch with cache settings: NoCache(modata, base_path=/omd/sites/mysite/tmp/check_mk/data_source_cache/piggyback, max_age=MaxAge(checking=0, discovery=120, inventory=120), disabled=True, use_outdated=False, simulation=False)
Not using cache (Cache usage disabled)
[PiggybackFetcher] Execute data source
Piggyback file '/omd/sites/mysite/tmp/check_mk/piggyback/modata/pve': Successfully processed from source 'pve'
No piggyback files for '172.16.14.25'. Skip processing.
Not using cache (Cache usage disabled)
[cpu_tracking] Stop [7fd284379eb0 - Snapshot(process=posix.times_result(user=0.0, system=0.0, children_user=0.0, children_system=0.0, elapsed=0.0))]
+ PARSE FETCHER RESULTS
  Source: SourceType.HOST/FetcherType.TCP
<<<check_mk>>> / Transition NOOPParser -> HostSectionParser
<<<cmk_agent_ctl_status:sep(0)>>> / Transition HostSectionParser -> HostSectionParser
<<<checkmk_agent_plugins_lnx:sep(0)>>> / Transition HostSectionParser -> HostSectionParser
<<<labels:sep(0)>>> / Transition HostSectionParser -> HostSectionParser
<<<df>>> / Transition HostSectionParser -> HostSectionParser
<<<df>>> / Transition HostSectionParser -> HostSectionParser
<<<systemd_units>>> / Transition HostSectionParser -> HostSectionParser
<<<nfsmounts>>> / Transition HostSectionParser -> HostSectionParser
<<<cifsmounts>>> / Transition HostSectionParser -> HostSectionParser
<<<mounts>>> / Transition HostSectionParser -> HostSectionParser
<<<ps_lnx>>> / Transition HostSectionParser -> HostSectionParser
<<<mem>>> / Transition HostSectionParser -> HostSectionParser
<<<cpu>>> / Transition HostSectionParser -> HostSectionParser
<<<uptime>>> / Transition HostSectionParser -> HostSectionParser
<<<lnx_if>>> / Transition HostSectionParser -> HostSectionParser
<<<lnx_if:sep(58)>>> / Transition HostSectionParser -> HostSectionParser
<<<tcp_conn_stats>>> / Transition HostSectionParser -> HostSectionParser
<<<multipath>>> / Transition HostSectionParser -> HostSectionParser
<<<diskstat>>> / Transition HostSectionParser -> HostSectionParser
<<<kernel>>> / Transition HostSectionParser -> HostSectionParser
<<<md>>> / Transition HostSectionParser -> HostSectionParser
<<<vbox_guest>>> / Transition HostSectionParser -> HostSectionParser
<<<job>>> / Transition HostSectionParser -> HostSectionParser
<<<timesyncd>>> / Transition HostSectionParser -> HostSectionParser
<<<local:sep(0)>>> / Transition HostSectionParser -> HostSectionParser
<<<check_mk:cached(1653896182,10800)>>> / Transition HostSectionParser -> HostSectionParser
<<<apt:cached(1653896186,10800):sep(0)>>> / Transition HostSectionParser -> HostSectionParser
<<<docker_node_info:cached(1653897623,300):sep(124)>>> / Transition HostSectionParser -> HostSectionParser
<<<docker_node_info:cached(1653897623,300):sep(0)>>> / Transition HostSectionParser -> HostSectionParser
<<<docker_node_disk_usage:cached(1653897623,300):sep(124)>>> / Transition HostSectionParser -> HostSectionParser
<<<docker_node_disk_usage:cached(1653897623,300):sep(0)>>> / Transition HostSectionParser -> HostSectionParser
<<<docker_node_images:cached(1653897623,300):sep(124)>>> / Transition HostSectionParser -> HostSectionParser
<<<docker_node_images:cached(1653897623,300):sep(0)>>> / Transition HostSectionParser -> HostSectionParser
<<<docker_node_network:cached(1653897623,300):sep(124)>>> / Transition HostSectionParser -> HostSectionParser
<<<docker_node_network:cached(1653897623,300):sep(0)>>> / Transition HostSectionParser -> HostSectionParser
<<<docker_container_node_name:cached(1653897623,300):sep(124)>>> / Transition HostSectionParser -> HostSectionParser
<<<docker_container_node_name:cached(1653897623,300):sep(0)>>> / Transition HostSectionParser -> HostSectionParser
Transition HostSectionParser -> NOOPParser
<<<docker_container_status:cached(1653897623,300):sep(124)>>> / Transition NOOPParser -> HostSectionParser
<<<docker_container_status:cached(1653897623,300):sep(0)>>> / Transition HostSectionParser -> HostSectionParser
Transition HostSectionParser -> NOOPParser
<<<docker_container_labels:cached(1653897623,300):sep(124)>>> / Transition NOOPParser -> HostSectionParser
<<<docker_container_labels:cached(1653897623,300):sep(0)>>> / Transition HostSectionParser -> HostSectionParser
Transition HostSectionParser -> NOOPParser
<<<docker_container_network:cached(1653897623,300):sep(124)>>> / Transition NOOPParser -> HostSectionParser
<<<docker_container_network:cached(1653897623,300):sep(0)>>> / Transition HostSectionParser -> HostSectionParser
Transition HostSectionParser -> NOOPParser
<<<docker_container_mem:cached(1653897623,300):sep(124)>>> / Transition NOOPParser -> HostSectionParser
<<<docker_container_mem:cached(1653897623,300):sep(0)>>> / Transition HostSectionParser -> HostSectionParser
Transition HostSectionParser -> NOOPParser
<<<docker_container_cpu:cached(1653897623,300):sep(124)>>> / Transition NOOPParser -> HostSectionParser
<<<docker_container_cpu:cached(1653897623,300):sep(0)>>> / Transition HostSectionParser -> HostSectionParser
Transition HostSectionParser -> NOOPParser
<<<docker_container_diskstat:cached(1653897623,300):sep(124)>>> / Transition NOOPParser -> HostSectionParser
<<<docker_container_diskstat:cached(1653897623,300):sep(0)>>> / Transition HostSectionParser -> HostSectionParser
Transition HostSectionParser -> NOOPParser
No persisted sections
  -> Add sections: ['apt', 'check_mk', 'checkmk_agent_plugins_lnx', 'cifsmounts', 'cmk_agent_ctl_status', 'cpu', 'df', 'diskstat', 'docker_container_cpu', 'docker_container_diskstat', 'docker_container_labels', 'docker_container_mem', 'docker_container_network', 'docker_container_node_name', 'docker_container_status', 'docker_node_disk_usage', 'docker_node_images', 'docker_node_info', 'docker_node_network', 'job', 'kernel', 'labels', 'lnx_if', 'local', 'md', 'mem', 'mounts', 'multipath', 'nfsmounts', 'ps_lnx', 'systemd_units', 'tcp_conn_stats', 'timesyncd', 'uptime', 'vbox_guest']
  Source: SourceType.HOST/FetcherType.PIGGYBACK
<<<proxmox_ve_vm_info:cached(1653897968,90):sep(0)>>> / Transition NOOPParser -> HostSectionParser
<<<proxmox_ve_mem_usage:cached(1653897968,90):sep(0)>>> / Transition HostSectionParser -> HostSectionParser
<<<proxmox_ve_vm_backup_status:cached(1653897968,90):sep(0)>>> / Transition HostSectionParser -> HostSectionParser
<<<proxmox_ve_vm_snapshot_age:cached(1653897968,90):sep(0)>>> / Transition HostSectionParser -> HostSectionParser
<<<labels:sep(0)>>> / Transition HostSectionParser -> HostSectionParser
No persisted sections
  -> Add sections: ['labels', 'proxmox_ve_mem_usage', 'proxmox_ve_vm_backup_status', 'proxmox_ve_vm_info', 'proxmox_ve_vm_snapshot_age']
Received no piggyback data
Received no piggyback data
[cpu_tracking] Start [7fd2842911f0]
value store: synchronizing
Trying to acquire lock on /omd/sites/mysite/tmp/check_mk/counters/modata
Got lock on /omd/sites/mysite/tmp/check_mk/counters/modata
value store: loading from disk
Releasing lock on /omd/sites/mysite/tmp/check_mk/counters/modata
Released lock on /omd/sites/mysite/tmp/check_mk/counters/modata
APT Updates          No updates pending for installation
CPU load             15 min load: 0.09, 15 min load per core: 0.02 (4 cores)
CPU utilization      PEND - No time difference
CPU utilization      Total CPU: 12.12%
Check_MK Agent       Version: 2.1.0, OS: linux, Last update: May 30 2022 08:50:37, Agent plugins: 5, Local checks: 6
Disk IO SUMMARY      Read: 0.00 B/s, Write: 89.3 kB/s, Latency: 205 microseconds
Docker container status Container running on node modata
Docker containers    Containers: 1, Running: 1, Paused: 0, Stopped: 0
Docker disk usage - buildcache Size: 0.00 B, Reclaimable: 0.00 B, Count: 0, Active: 0
Docker disk usage - containers Size: 5.00 B, Reclaimable: 0.00 B, Count: 1, Active: 1
Docker disk usage - images Size: 1.33 GB, Reclaimable: 0.00 B, Count: 1, Active: 1
Docker disk usage - volumes Size: 0.00 B, Reclaimable: 0.00 B, Count: 0, Active: 0
Docker node info     Daemon running on host modata
DockerContainer modata CPU 3.8% // MEM 2.9 GiB (37.87%), Util: 3.80, Mem used: 3157639168.00, Mem used percent: 37.87, Uptime: 403951.00, Cache generated 5 minutes 48 seconds ago, cache interval: 5 minutes 0 seconds, elapsed cache lifespan: 116.12%
Filesystem /         40.74% used (15.19 of 37.27 GB), trend: +85.66 kB / 24 hours - time left until disk full: more than a year
Filesystem /boot     18.54% used (360.67 MB of 1.90 GB), trend: 0.00 B / 24 hours
Interface 2          [ens18], (up), MAC: AE:4F:BE:53:5B:AA, Speed: unknown, In: 9.09 kB/s, Out: 68.0 kB/s
Job modata_backup    Item not found in monitoring data
Logrotation          Rotation as expected
Memory               Total virtual memory: 19.97% - 2.35 GB of 11.76 GB
Memory used          RAM: 28.17% - 2.19 GiB of 7.76 GiB
Mount options of /   Mount options exactly as expected
Mount options of /boot Mount options exactly as expected
Proxmox VE VM Backup Status Age: 9 hours 17 minutes, Server local start time: 2022-05-30 00:48:29+02:00, Duration: 21 seconds, Bandwidth: 74.6 MB/s
Reboot               OK
Systemd Service Summary Total: 147, Disabled: 2, Failed: 1
Systemd Timesyncd Time Offset: 78 microseconds, Time since last sync: 31 minutes 20 seconds, Stratum: 2.00, Jitter: Jan 01 1970 01:00:00, Synchronized on 2001:67c:1560:8003::c8
UFW                  running
Uptime               Up since May 25 2022 19:44:36, Uptime: 4 days 14 hours
+ EXECUTING INVENTORY PLUGINS
 aruba_wlc_aps: skipped (no data)
 aruba_wlc_aps: skipped (no data)
 check_mk: ok
 check_mk: skipped (no data)
 checkmk_agent_plugins: ok
 checkmk_agent_plugins: skipped (no data)
 docker_node_info: ok
 docker_node_info: skipped (no data)
 fritz: skipped (no data)
 fritz: skipped (no data)
 hp_proliant_da_phydrv: skipped (no data)
 hp_proliant_da_phydrv: skipped (no data)
 hp_proliant_mem: skipped (no data)
 hp_proliant_mem: skipped (no data)
 ibm_mq_channels: skipped (no data)
 ibm_mq_channels: skipped (no data)
 ibm_mq_managers: skipped (no data)
 ibm_mq_managers: skipped (no data)
 ibm_mq_queues: skipped (no data)
 ibm_mq_queues: skipped (no data)
 ipmi_firmware: skipped (no data)
 ipmi_firmware: skipped (no data)
 inv_cisco_vlans: skipped (no data)
 inv_cisco_vlans: skipped (no data)
 inv_esx_vsphere_hostsystem: skipped (no data)
 inv_esx_vsphere_hostsystem: skipped (no data)
 inv_if: ok
 inv_if: skipped (no data)
 aix_packages: skipped (no data)
 aix_packages: skipped (no data)
 aix_service_packs: skipped (no data)
 aix_service_packs: skipped (no data)
 inventory_checkmk: skipped (no data)
 inventory_checkmk: skipped (no data)
 checkpoint_vpn_tunnels: skipped (no data)
 checkpoint_vpn_tunnels: skipped (no data)
 dmidecode: skipped (no data)
 dmidecode: skipped (no data)
 docker_container_labels: ok
 docker_container_labels: skipped (no data)
 docker_container_network: ok
 docker_container_network: skipped (no data)
 docker_node_images: ok
 docker_node_images: skipped (no data)
 docker_node_network: ok
 docker_node_network: skipped (no data)
 inventory_esx_vsphere_clusters: skipped (no data)
 inventory_esx_vsphere_clusters: skipped (no data)
 inventory_esx_vsphere_virtual_machines: skipped (no data)
 inventory_esx_vsphere_virtual_machines: skipped (no data)
 fortiauthenticator_system: skipped (no data)
 fortiauthenticator_system: skipped (no data)
 fortigate_ha: skipped (no data)
 fortigate_ha: skipped (no data)
 fortimail_system: skipped (no data)
 fortimail_system: skipped (no data)
 fortisandbox_software: skipped (no data)
 fortisandbox_software: skipped (no data)
 fortisandbox_system: skipped (no data)
 fortisandbox_system: skipped (no data)
 k8s_assigned_pods: skipped (no data)
 k8s_assigned_pods: skipped (no data)
 k8s_daemon_pod_containers: skipped (no data)
 k8s_daemon_pod_containers: skipped (no data)
 k8s_endpoint_info: skipped (no data)
 k8s_endpoint_info: skipped (no data)
 k8s_ingress_infos: skipped (no data)
 k8s_ingress_infos: skipped (no data)
 k8s_job_container: skipped (no data)
 k8s_job_container: skipped (no data)
 kube_cluster: skipped (no data)
 kube_cluster: skipped (no data)
 kube_daemonset: skipped (no data)
 kube_daemonset: skipped (no data)
 kube_deployment: skipped (no data)
 kube_deployment: skipped (no data)
 kube_namespace: skipped (no data)
 kube_namespace: skipped (no data)
 kube_node: skipped (no data)
 kube_node: skipped (no data)
 kube_pod: skipped (no data)
 kube_pod: skipped (no data)
 kube_statefulset: skipped (no data)
 kube_statefulset: skipped (no data)
 lnx_block_devices: skipped (no data)
 lnx_block_devices: skipped (no data)
 lnx_ip_r: skipped (no data)
 lnx_ip_r: skipped (no data)
 lnx_packages: skipped (no data)
 lnx_packages: skipped (no data)
 lnx_sysctl: skipped (no data)
 lnx_sysctl: skipped (no data)
 lnx_video: skipped (no data)
 lnx_video: skipped (no data)
 mssql_clusters: skipped (no data)
 mssql_clusters: skipped (no data)
 oracle_systemparameter: skipped (no data)
 oracle_systemparameter: skipped (no data)
 snmp_extended_info: skipped (no data)
 snmp_extended_info: skipped (no data)
 solaris_addresses: skipped (no data)
 solaris_addresses: skipped (no data)
 solaris_pkginfo: skipped (no data)
 solaris_pkginfo: skipped (no data)
 solaris_psrinfo: skipped (no data)
 solaris_psrinfo: skipped (no data)
 solaris_cpus: skipped (no data)
 solaris_cpus: skipped (no data)
 solaris_prtpicl: skipped (no data)
 solaris_prtpicl: skipped (no data)
 solaris_routes: skipped (no data)
 solaris_routes: skipped (no data)
 statgrab_net: skipped (no data)
 statgrab_net: skipped (no data)
 win_disks: skipped (no data)
 win_disks: skipped (no data)
 win_exefiles: skipped (no data)
 win_exefiles: skipped (no data)
 win_ip_r: skipped (no data)
 win_ip_r: skipped (no data)
 win_networkadapter: skipped (no data)
 win_networkadapter: skipped (no data)
 win_reg_uninstall: skipped (no data)
 win_reg_uninstall: skipped (no data)
 win_video: skipped (no data)
 win_video: skipped (no data)
 win_wmi_software: skipped (no data)
 win_wmi_software: skipped (no data)
 win_wmi_updates: skipped (no data)
 win_wmi_updates: skipped (no data)
 juniper_info: skipped (no data)
 juniper_info: skipped (no data)
 k8s_nodes: skipped (no data)
 k8s_nodes: skipped (no data)
 k8s_pod_container: skipped (no data)
 k8s_pod_container: skipped (no data)
 k8s_roles: skipped (no data)
 k8s_roles: skipped (no data)
 lnx_if: ok
 lnx_if: skipped (no data)
 mem: ok
 mem: skipped (no data)
 mem_used: ok
 mem_used: skipped (no data)
 mssql_instance: skipped (no data)
 mssql_instance: skipped (no data)
 netapp_api_disk: skipped (no data)
 netapp_api_disk: skipped (no data)
 oracle_dataguard_stats: skipped (no data)
 oracle_dataguard_stats: skipped (no data)
 oracle_instance: skipped (no data)
 oracle_instance: skipped (no data)
 oracle_performance: skipped (no data)
 oracle_performance: skipped (no data)
 oracle_recovery_area: skipped (no data)
 oracle_recovery_area: skipped (no data)
 oracle_tablespaces: skipped (no data)
 oracle_tablespaces: skipped (no data)
 perle_chassis_slots: skipped (no data)
 perle_chassis_slots: skipped (no data)
 perle_psmu: skipped (no data)
 perle_psmu: skipped (no data)
 snmp_info: skipped (no data)
 snmp_info: skipped (no data)
 winperf_if: skipped (no data)
 winperf_if: skipped (no data)
 aix_baselevel: skipped (no data)
 aix_baselevel: skipped (no data)
 aix_lparstat_inventory: skipped (no data)
 aix_lparstat_inventory: skipped (no data)
 allnet_ip_sensoric: skipped (no data)
 allnet_ip_sensoric: skipped (no data)
 citrix_controller: skipped (no data)
 citrix_controller: skipped (no data)
 citrix_state: skipped (no data)
 citrix_state: skipped (no data)
 couchbase_nodes_ports: skipped (no data)
 couchbase_nodes_ports: skipped (no data)
 dell_hw_info: skipped (no data)
 dell_hw_info: skipped (no data)
 docker_container_node_name: ok
 docker_container_node_name: skipped (no data)
 esx_systeminfo: skipped (no data)
 esx_systeminfo: skipped (no data)
 fireeye_sys_status: skipped (no data)
 fireeye_sys_status: skipped (no data)
 hp_proliant_systeminfo: skipped (no data)
 hp_proliant_systeminfo: skipped (no data)
 infoblox_osinfo: skipped (no data)
 infoblox_osinfo: skipped (no data)
 infoblox_systeminfo: skipped (no data)
 infoblox_systeminfo: skipped (no data)
 k8s_pod_info: skipped (no data)
 k8s_pod_info: skipped (no data)
 k8s_selector: skipped (no data)
 k8s_selector: skipped (no data)
 k8s_service_info: skipped (no data)
 k8s_service_info: skipped (no data)
 lnx_cpuinfo: skipped (no data)
 lnx_cpuinfo: skipped (no data)
 lnx_distro: skipped (no data)
 lnx_distro: skipped (no data)
 lnx_uname: skipped (no data)
 lnx_uname: skipped (no data)
 lparstat_aix: skipped (no data)
 lparstat_aix: skipped (no data)
 netapp_api_info: skipped (no data)
 netapp_api_info: skipped (no data)
 perle_chassis: skipped (no data)
 perle_chassis: skipped (no data)
 prtconf: skipped (no data)
 prtconf: skipped (no data)
 snmp_os: skipped (no data)
 snmp_os: skipped (no data)
 snmp_quantum_storage_info: skipped (no data)
 snmp_quantum_storage_info: skipped (no data)
 solaris_prtdiag: skipped (no data)
 solaris_prtdiag: skipped (no data)
 solaris_uname: skipped (no data)
 solaris_uname: skipped (no data)
 suseconnect: skipped (no data)
 suseconnect: skipped (no data)
 win_bios: skipped (no data)
 win_bios: skipped (no data)
 win_computersystem: skipped (no data)
 win_computersystem: skipped (no data)
 win_cpuinfo: skipped (no data)
 win_cpuinfo: skipped (no data)
 win_os: skipped (no data)
 win_os: skipped (no data)
 win_system: skipped (no data)
 win_system: skipped (no data)

Trying to acquire lock on /omd/sites/mysite/tmp/check_mk/status_data/modata
Got lock on /omd/sites/mysite/tmp/check_mk/status_data/modata
Releasing lock on /omd/sites/mysite/tmp/check_mk/status_data/modata
Released lock on /omd/sites/mysite/tmp/check_mk/status_data/modata
Trying to acquire lock on /omd/sites/mysite/tmp/check_mk/status_data/modata.gz
Got lock on /omd/sites/mysite/tmp/check_mk/status_data/modata.gz
Releasing lock on /omd/sites/mysite/tmp/check_mk/status_data/modata.gz
Released lock on /omd/sites/mysite/tmp/check_mk/status_data/modata.gz
Trying to acquire lock on /omd/sites/mysite/tmp/check_mk/status_data/.last
Got lock on /omd/sites/mysite/tmp/check_mk/status_data/.last
Releasing lock on /omd/sites/mysite/tmp/check_mk/status_data/.last
Released lock on /omd/sites/mysite/tmp/check_mk/status_data/.last
Piggyback file '/omd/sites/mysite/tmp/check_mk/piggyback/modata/pve': Successfully processed from source 'pve'
No piggyback files for '172.16.14.25'. Skip processing.
[cpu_tracking] Stop [7fd2842911f0 - Snapshot(process=posix.times_result(user=0.06999999999999984, system=0.019999999999999962, children_user=0.0, children_system=0.0, elapsed=0.08999999985098839))]
[agent] Success, [piggyback] Successfully processed from source 'pve', execution time 2.7 sec | execution_time=2.660 user_time=0.080 system_time=0.030 children_user_time=0.000 children_system_time=0.000 cmk_time_agent=2.550
Hello dear CheckMK community!
The services on our host called modata have been migrated to a new Host (old Host: MSSQL installed via apt, new host: MSSQL in docker). After that I just shutdown the old modata and installed the agent + registering on the new modata (with the same name).
Since then I see the error above.
I have also tried to remove modata from CheckMK, activate changes, add modata again and I still get the error when discovering new services.
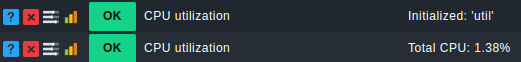
When discovering new services, I see 2 services “CPU utilization”.
CheckMK Plugins directory on modata
root@modata /usr/lib/check_mk_agent/plugins# ls -lR
.:
total 16
drwxrwxr-x 2 root root 4096 Mai 30 10:37 10800
drwxrwxr-x 2 root root 4096 Mai 30 10:37 300
-rwxr-xr-x 1 root root 4898 Mai 22 12:26 mk_inventory

./10800:
total 12940
-rwxr-xr-x 1 root root 13244920 Mai 22 12:50 cmk-update-agent
-rwxr-xr-x 1 root root     1591 Mai 25 15:54 mk_apt

./300:
total 48
-rwxr-xr-x 1 root root 22691 Mai 22 12:40 mk_docker_2.py
-rwxr-xr-x 1 root root 22522 Mai 22 12:26 mk_docker.py
How do I get rid of one of these services, which one is the real one and how did I even end up with 2 identical services?
FYI modata has existed and was monitored before upgrade to CheckMK 2.1.0
Thanks in advance and with best regards,
Pixelpoint