Graph metrics from REST API

CMK version:2.1.0p30

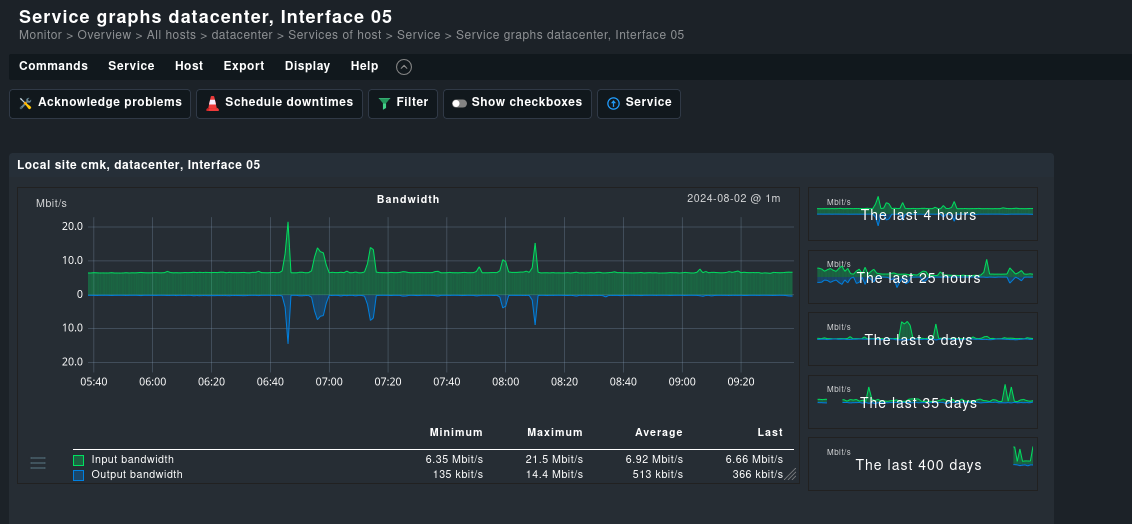
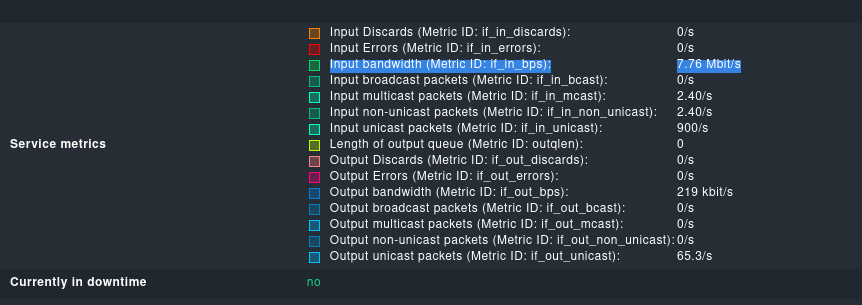
Hello, I’ve been trying to extract the metrics of a service from the REST API, but I can’t find a way to do it. For example, I’d like to extract these metrics from Interface 5 (input and output bandwidth) over a certain period of time (let’s say the last 3 months):

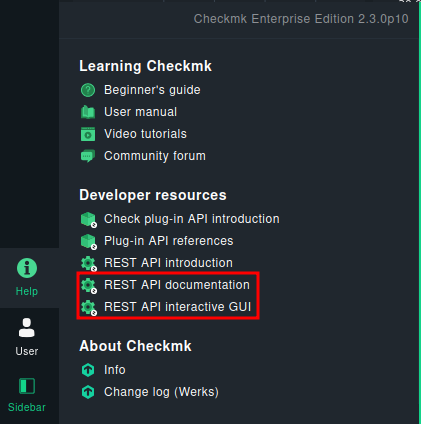
I can’t find anything on swagger, and I’ve found online that there is something called “get_graph” used in the old WEB API, which are now deprecated and I’d like not to use.

Is there a solution to this problem?
Thanks

2.1 is quite old now so not sure what was available there but there are Metrics endpoints in at least 2.3

1 Like

Anders is right, 2.1 did not yet feature the relevant endpoints. I am not entirely sure, if we introduced them with 2.2 or 2.3 but I want to say 2.2.
Anyways, it is a good idea to get updating as 2.1 is approaching its end of life at the end of this year.

Thanks for your feedback.
I also have a CheckMK RAW edition up to date for testing purposes, so I’d like to do get started with it.
May I ask what the endpoint might be?

These two are your friends here:
image
Look for “Metrics”: http://$MYHOST/$MYSITEcheck_mk/api/doc/#tag/Metrics

I’ve found this: /domain-types/metric/actions/get/invoke

here’s a basic request generated by swagger:

curl -X 'POST' \
  'https://monitoring.myserver.com/cmk/check_mk/api/1.0/domain-types/metric/actions/get/invoke' \
  -H 'accept: application/json' \
  -H 'Content-Type: application/json' \
  -d '{
  "time_range": {
    "start": "2024-08-04 23:45:09.065558",
    "end": "2024-08-05 00:00:09.065566"
  },
  "reduce": "max",
  "site": "cmk",
  "host_name": "datacenter",
  "service_description": "Check_MK",
  "type": "single_metric",
  "graph_id": "cmk_cpu_time_by_phase"
}'

And I get this response:

{
  "title": "Bad Request",
  "status": 400,
  "detail": "These fields have problems: metric_id, graph_id",
  "fields": {
    "metric_id": [
      "Missing data for required field."
    ],
    "graph_id": [
      "Unknown field."
    ]
  }
}

I’ve used the default generated settings, I don’t know what the metric_id and graph_id might be and where I could find them

You want to review the ReDoc carefully again.

  "type": "single_metric",
  "graph_id": "cmk_cpu_time_by_phase"

Those two do not go together. You need "type": "single_metric" and then a metric_id.

Thanks.
I’ve been reading the ReDoc about this and it’s indeed correct. The strange thing is that this is generated by default in Swagger:
image

Now here’s the request that I’ve made:

curl -X 'POST' \
  'https://monitoring.myserver.com/cmk/check_mk/api/1.0/domain-types/metric/actions/get/invoke' \
  -H 'accept: application/json' \
  -H 'Content-Type: application/json' \
  -d '{
  "time_range": {
    "start": "2024-08-04 23:45:09.065558",
    "end": "2024-08-05 00:00:09.065566"
  },
  "reduce": "max",
  "site": "cmk",
  "host_name": "datacenter",
  "service_description": "Interface 05",
  "type": "single_metric",
  "metric_id": "if_in_bps"
}'

And the metric_id that I got:

However… here’s the response:

{
  "title": "Bad Request",
  "status": 400,
  "detail": "2 validation errors for GraphDataRange\ntime_range.0\n  Input should be a valid integer, got a number with a fractional part [type=int_from_float, input_value=1722815109.065558, input_type=float]\n    For further information visit https://errors.pydantic.dev/2.5/v/int_from_float\ntime_range.1\n  Input should be a valid integer, got a number with a fractional part [type=int_from_float, input_value=1722816009.065566, input_type=float]\n    For further information visit https://errors.pydantic.dev/2.5/v/int_from_float"
}

I don’t know what I’m doing wrong this time '^^

I’ve found the solution.
I’ve removed .065558 and .065566 from the timestamp:

curl -X 'POST' \
  'https://monitoring.myserver.com/cmk/check_mk/api/1.0/domain-types/metric/actions/get/invoke' \
  -H 'accept: application/json' \
  -H 'Content-Type: application/json' \
  -d '{
  "time_range": {
    "start": "2024-08-04 23:45:09",
    "end": "2024-08-05 00:00:09"
  },
  "reduce": "max",
  "site": "cmk",
  "host_name": "datacenter",
  "service_description": "Interface 05",
  "type": "single_metric",
  "metric_id": "if_in_bps"
}'

Now I finally got a response 200 :slight_smile:

{
  "time_range": {
    "start": "2024-08-04T23:45:00+00:00",
    "end": "2024-08-05T00:01:00+00:00"
  },
  "step": 60,
  "metrics": [
    {
      "color": "#00e060",
      "data_points": [
        3867670,
        3612520,
        3568890,
        3743470,
        3661540,
        3600280,
        3566930,
        3779100,
        3638100,
        3575720,
        4086510,
        3947310,
        3629560,
        3786060,
        4322790,
        3812930
      ],
      "line_type": "area",
      "title": "Input bandwidth"
    }
  ]
}
2 Likes

I reported the typo in Swagger to our development, they will probably fix it in a future release. :v:

2 Likes

This topic was automatically closed 365 days after the last reply. New replies are no longer allowed. Contact an admin if you think this should be re-opened.