Graph not rendering in Main Dashboard

**CMK version: 2.0.0p27
**OS version: CheckMK Appliance 1.4.19

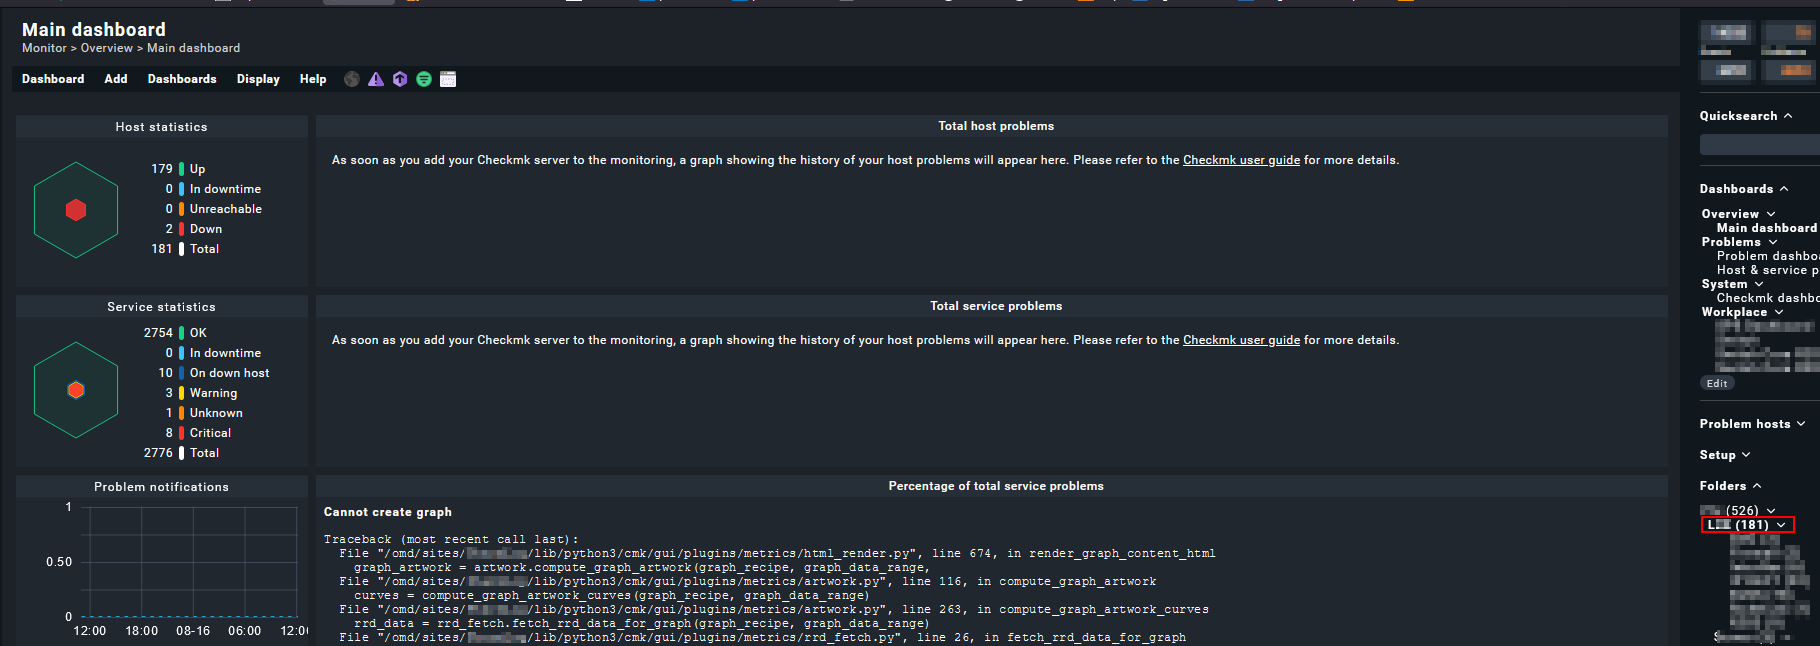
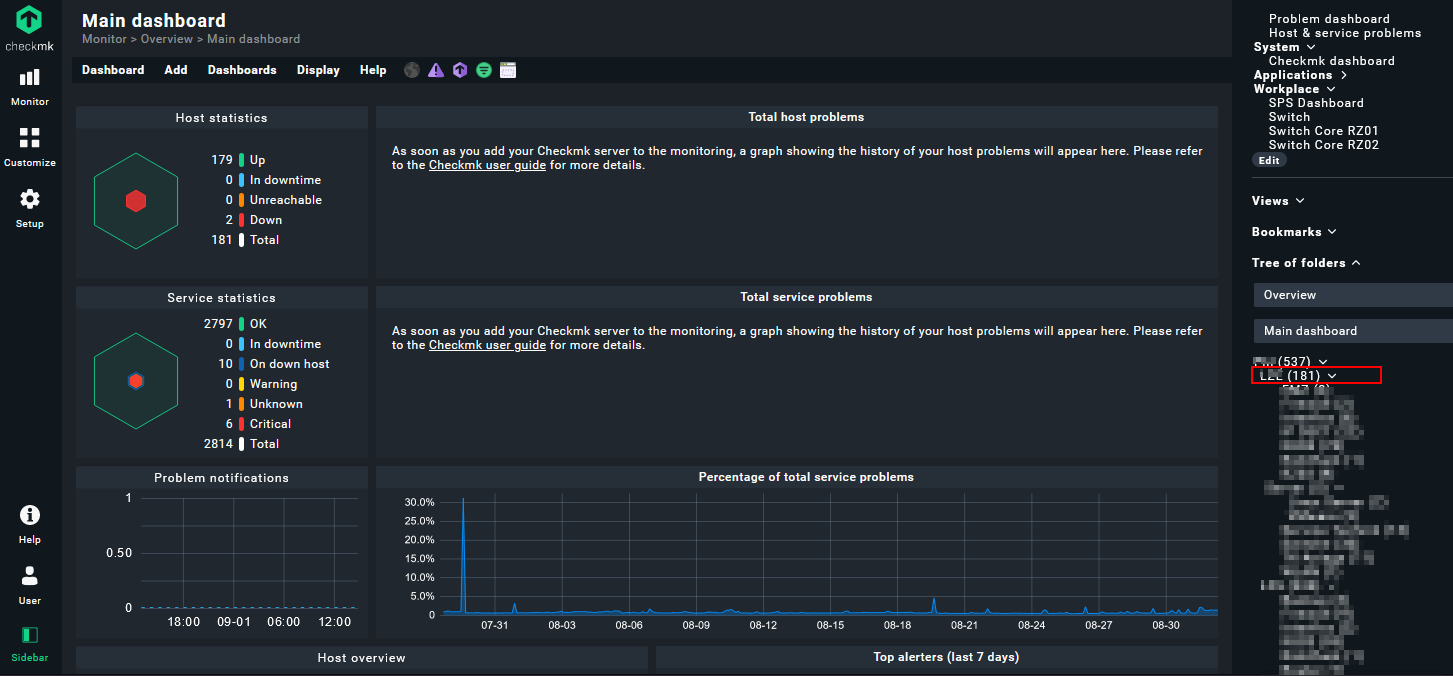
Error message: “Sorry, you cannot create combined graphs for more than 100 objects” (Percentage of total service problems on Main Dashboard)

Ironically, the very Werk that was supposed to fix this error actually seems to have introduced it for us. The problem first occured after updating to 2.0.0p27.

Additional Info: We have one remote site connected to the main site via livestatus / distributed monitoring.

Hello, we have the same issue in distributed setting, but only when we log in directly on a slave site, not on the master site.

**CMK version: 2.0.0p27cee
**OS version: RHEL 7.9

regards
Christian

Hallo,
similar Problems in Version 2.1.
Ralf

Hi,
in my case it was this filter which was missing after the update:


regards,
Franz

This section (Context / Search filters) is not available for the “Percentage of service Problems” view.

image

my Version: CEE 2.1.0p8

1 Like

This is our exact problem with 2.0.0p27.cee (Ubuntu 20.04.4 LTS). Trying to clone the Main Dashboard for just our DBAs and getting this:

Percentage of total service problems

Cannot create graph

Traceback (most recent call last):
  File "/omd/sites/bmd/lib/python3/cmk/gui/plugins/metrics/html_render.py", line 674, in render_graph_content_html
    graph_artwork = artwork.compute_graph_artwork(graph_recipe, graph_data_range,
  File "/omd/sites/bmd/lib/python3/cmk/gui/plugins/metrics/artwork.py", line 116, in compute_graph_artwork
    curves = compute_graph_artwork_curves(graph_recipe, graph_data_range)
  File "/omd/sites/bmd/lib/python3/cmk/gui/plugins/metrics/artwork.py", line 263, in compute_graph_artwork_curves
    rrd_data = rrd_fetch.fetch_rrd_data_for_graph(graph_recipe, graph_data_range)
  File "/omd/sites/bmd/lib/python3/cmk/gui/plugins/metrics/rrd_fetch.py", line 26, in fetch_rrd_data_for_graph

@CFriedrich did you get anywhere with this on your end?

Scott

Thank you, this solved my problem with that graph.
CME 2.1.0p9

I believe we have a similar Problem.

Main Dashboard “Total Host problems”, “Total service problems” and “Percentage of total service problems” are not working in Subfolder(s):

I can open the Graphs / Views if i click on “Total Host problems”, “Total service problems” and “Percentage of total service problems”.

The Top Folder looks to be ok.

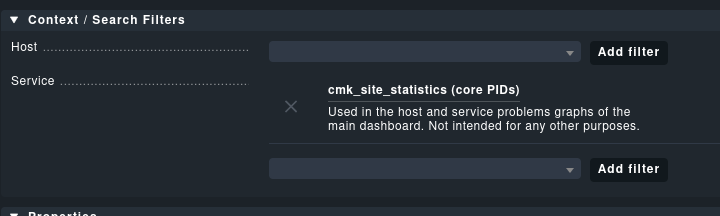
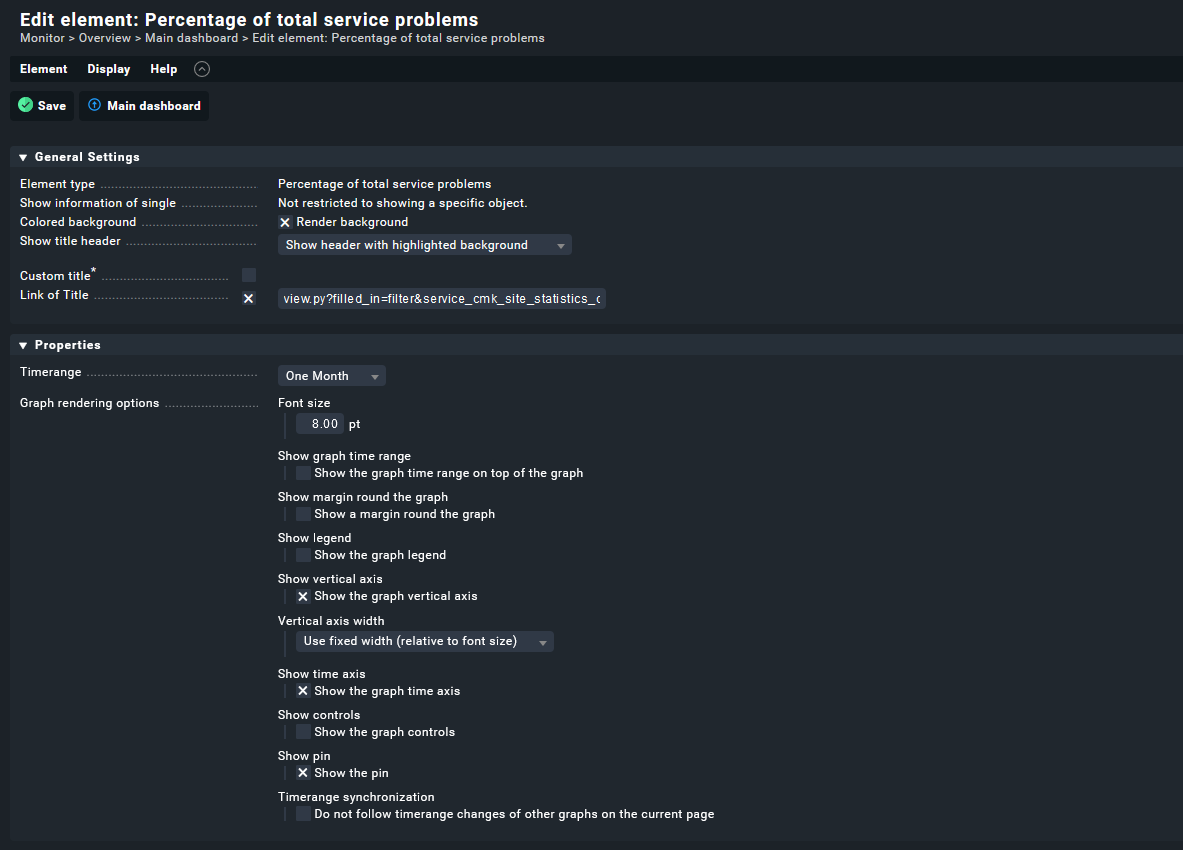
“Total Host problems” and “Total service problems” already have Service: “cmk_site_statistics (core PIDs)”. For “Percentage of total service problems” it looks like there is no Service Settings in checkmk 2.0.x

Just in case somebody else has trouble finding the Settings:
Main Dashboard → Dashboard → Enter layout mode → Edit properties of this element

checkmk 2.0.0p27 (CEE), no remote Site.

updated yesterday - same peorblem here

Hi all,
I guess this werk addresses the issue:

But as far as I understand, the only difference will be, that we get a text message instead of the exception. But we won’t get a working performance graph as before?!

regards
Christian

the funny part is, some of my collegues dont get the message - some others do…

And yes, the werk I also understand like, “let’s remove the errors but its still not fixed”
all related to this

Hi,
let’s begin with a bit of clarification. There are three werks involved here:

Whether or not you see the error message heavily depends on your setup. However, I think that during the development of these three werks, a new issue was introduced (by mistake). Could you please place this file (version-dependent)
problem_percentage_2.0.py (4.5 KB)
problem_percentage_2.1.py (5.2 KB)
in
/opt/omd/versions/.../lib/python3/cmk/gui/cee/plugins/dashboard/problem_percentage.py
restart you site and check if the error goes away?
Best, Jörg

2 Likes

Sorry, we updated our single-site from 2.0.0p28 to checkmk 2.1.0p11 yesterday. The Dashboard error was still there, then I reread the linked manual page in the Error message and fixed it.

We only had the monitoring server added as “localhost”. Added the monitoring server as “hostname” too and the error went away.

Maybe the real problem is the manual (should tell this requirement more clearly).

BTW: “Percentage of total service problems” didn’t show the error in checkmk 2.1.0p11 before adding the monitoring server with hostname.

UPDATE: Ok, this did not fix it… i am gonna test your file.

Did the test with problem_percentage_2.1.py on 2.1.0.p11 cee


“Percentage of total service problems” is showing data in Subfolder.

[root@linux dashboard]# pwd
/opt/omd/versions/2.1.0p11.cee/lib/python3/cmk/gui/cee/plugins/dashboard
[root@linux dashboard]# diff problem_percentage.py problem_percentage.py.bak 
48c48
<         return ("explicit", self._recipe())
---
>         return ("explicit", self._recipe(context))
50,55c50
<     def _recipe(self) -> Dict[str, Any]:
<         context = {
<             "service_cmk_site_statistics_core_pid": {
<                 "service_cmk_site_statistics_core_pid": "",
<             },
<         }
---
>     def _recipe(self, context: VisualContext) -> Dict[str, Any]:

Thank you for your feedback. The fix has been merged: Fix Percentage of service problems dashlet in custom dashboards
Best, Jörg

1 Like

This topic was automatically closed 365 days after the last reply. New replies are no longer allowed. Contact an admin if you think this should be re-opened.