Check_MK agent plugin for monitoring SAP HANA databases.
To make this plugin work you have to configure
-USERSTOREKEY or
-USER and PASSWORD
ie. USERSTOREKEY=SVAMON and SID=I08 means we need a key
for SVAMONI08 in the HDB userstore specified in
$MK_CONFDIR/sap_hana.cfg
Moreover you can configure ‘RUNAS’ with the following values:
-‘agent’ or
-‘instance’
Use the FQDN in the query if HOSTNAME is not set, other the
short hostname.
What is the format of that USERSTOREKEY or USER and PASSWORD in sap_hana.cfg ? Example shows two parameters but how are they written? Same line with space? Comma? New line? How is that example USERSTOREKEY associated with SID (if there is more than one SID)? How is “HDB userstore specified in sap_hana.cfg”? What roles does the user need? MONITORING? What about RUNAS? Why use that?
That’s a lot of questions in a few lines But let me see what I can do for you.
You use either USERSTOREKEY or USER and PASSWORD. I’m using USERSTOREKEY. In my sap_hana.cfg it looks like this:
USERSTOREKEY=DHE_MONI
SID=DHE
So, that is each entry on a new line, no delimiters etc. If there’s more than one SID, I honestly don’t know.
The userstore (and user) was setup by our HANA administrator so I don’t know what rights the user has. However I do know there’s a MONITORING role in SAP HANA, so you may want to start there.
I’ve set mine to use RUNAS agent. Don’t know the difference, but in my case that works. So, my whole sap_hana.cfg looks like this:
USERSTOREKEY=DHE_MONI
SID=DHE
RUNAS=agent
If you’re facing issues with the plugin logging into the HANA database you may also want to check out this post: Monitoring SAP R/3 + SAP HANA
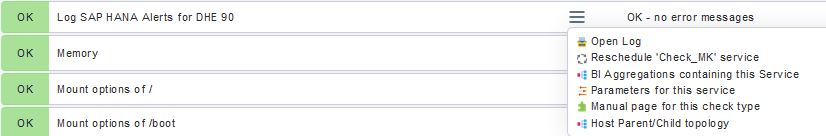
The Log SAP HANA Alerts for x has this check manual in the GUI:
This check processes the output of agents with the logwatch plugin. The windows agent […]. The logwatch extension of the Linux/UNIX agents needs a configuration file that lists all relevant logfiles and lists possible log lines that should result in warning or critical state. The windows agents […].
Relevant log messages found by the agent are stored locally into a text file. The check is critical, if at least one new or old log message exists that is classified as critical. If at least one warning message exists but no critical, the check results in a warning state.
The only way to bring the state back to OK is to delete the text file with the stored log messages. This is stored below ~/var/check_mk/logwatch . Usually the logwatch webpage is used to browse and delete the messages. Please refer to the online documentation of check_mk for more details about logwatch.
Since there is no webpage for the HANA plugin, I’m using this page for logwatch guidance:
I understand I must use the logwatch.cfg like I already do for other log checks. However the header of the cfg file is supposed to be the path of the log but this plugins checks in the database. What is the header?
The quoted part is the documentation for the Log SAP HANA Alerts. It talks about logwatch. If I then don’t read the logwatch doc, what do I read and how does it work? How do I configure the level of each alert (Critical, Warn, Ignore, etc).
Ah, I seen now what you mean. That’s a whole other question then your initial one.
For logwatch, how do you configure the level of each alert? Far as I know you don’t. It reads the logfile(s) and based on what the application logs the alert level is set. So if the application logs something as warning it’s a warning. And if it logs an error, logwatch regards it as an error.
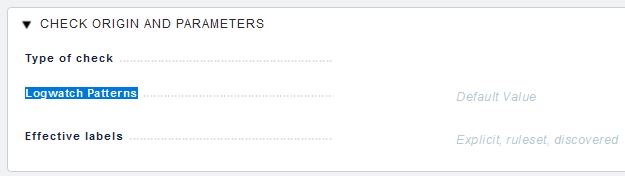
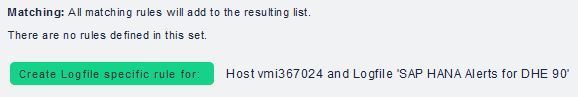
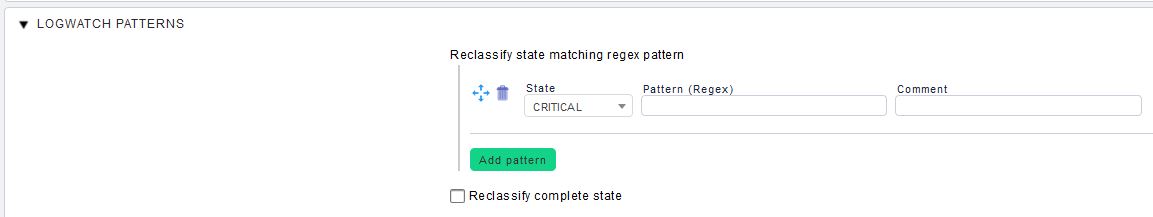
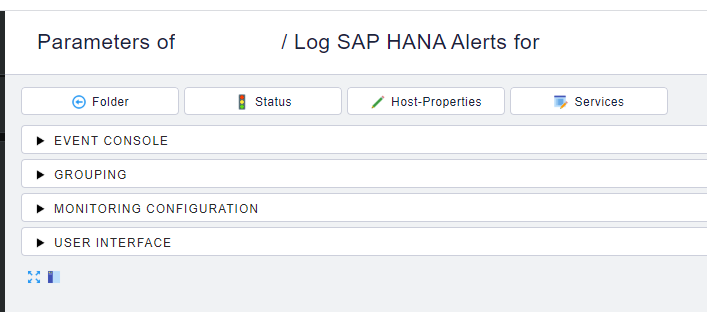
However, what you can do is open the check, and in the service icons clik on the three horizontal lines and choose “Parameters for this service”. Then clik on “Logwatch patterns”, “Create logfile specific rule for”. And there you can add patterns in the log to search for and specify the criticality of the event.
So no “Check origin and parameters” and no section containing “Logwatch Patterns”. But of course “Logwatch Patterns” does exist in WATO. If I create a rule about this alert, maybe it will still work. I’ll try.
Oh well. It’s working. At first I created a rule to change a particular CRIT to a WARN and in the history they all did. Then I changed the rule to change it to IGNORE and they all disappeared. I guess this covers everything. Thanks louis!