I would like to monitor the CPU usage of my Netgear switches.
I have found the oid for it from the SNMP walk. .1.3.6.1.4.1.4526.11.1.1.4.9.0 5 Secs ( 70%) 60 Secs ( 80.12231%) 300 Secs ( 80%)
How would I add the 5 Sec value to a check?
I’m completely new to making custom checks and need some guidance.
I’m currently using cmk version 1.5.0p16 Enterprise.
From the NETGEAR-SWITCHING-MIB I see this oid relates to agentSwitchCpuProcessTotalUtilization. I am not sure what values you were looking for with 2, 3 and 8.
From memory, try this.
  def inventory_netg_cpu(info):
     # Debug: lets see how the data we get looks like
     import pprint;pprint.pprint(info)
     return [ (None, None) ]

  def check_netg_cpu(item, params, info):
     return (3, "UNKNOWN - not yet implemented")

  check_info["netg_cpu"] = {
      "inventory_function"    : inventory_netg_cpu,
      "check_function"        : check_netg_cpu,
      "service_description"   : "CPU Utilization (5 Sec.)",
      "snmp_scan_function"    : lambda oid: oid(".1.3.6.1.2.1.1.2.0").startswith(".1.3.6.1.4.1.4526.") and \
                                            oid(".1.3.6.1.4.1.4526.11.1.1") != None
      "snmp_info"             : ( ".1.3.6.1.4.1.4526.11.1.1.4.9", ["0"] )
  }
If you run an inventory with that check against your switch it will print the contents of info. You can then undestand how the data is returned and can check it before returning the results.
cmk -v --checks netg_cpu -II XS716T-switch
In the check_netg_cpu function you can then extract the 5 second percentage and return that as the details to the check.
OMD[mysite]:~$ cmk --debug -vv --checks my_netgear_cpu switch1
[cpu_tracking] Start with phase 'busy'
Check_MK version 1.6.0p8
Try aquire lock on /omd/sites/mysite/tmp/check_mk/counters/switch1
Got lock on /omd/sites/mysite/tmp/check_mk/counters/switch1
Releasing lock on /omd/sites/mysite/tmp/check_mk/counters/switch1
Released lock on /omd/sites/mysite/tmp/check_mk/counters/switch1
Loading autochecks from /omd/sites/mysite/var/check_mk/autochecks/switch1.mk
+ FETCHING DATA
[cpu_tracking] Push phase 'snmp' (Stack: ['busy'])
 [snmp] No persisted sections loaded
 [snmp] Not using cache (Don't try it)
 [snmp] Execute data source
 [snmp] my_netgear_cpu: Fetching data
Executing WALK of ".1.3.6.1.4.1.4526.11.1.1.4.9" on switch1
.1.3.6.1.4.1.4526.11.1.1.4.9.0 => [    5 Secs ( 24.2257%)   60 Secs ( 26.82%)  300 Secs ( 28.5991%)] 'OCTETSTR'
 [snmp] Write data to cache file /omd/sites/mysite/tmp/check_mk/data_source_cache/snmp/switch1
Try aquire lock on /omd/sites/mysite/tmp/check_mk/data_source_cache/snmp/switch1
Got lock on /omd/sites/mysite/tmp/check_mk/data_source_cache/snmp/switch1
Releasing lock on /omd/sites/mysite/tmp/check_mk/data_source_cache/snmp/switch1
Released lock on /omd/sites/mysite/tmp/check_mk/data_source_cache/snmp/switch1
[cpu_tracking] Pop phase 'snmp' (Stack: ['busy', 'snmp'])
[cpu_tracking] Push phase 'agent' (Stack: ['busy'])
 [piggyback] No persisted sections loaded
 [piggyback] Execute data source
No piggyback files for 'switch1'. Skip processing.
No piggyback files for 'IP OF SWITCH'. Skip processing.
[cpu_tracking] Pop phase 'agent' (Stack: ['busy', 'agent'])
[cpu_tracking] End
OK - [snmp] Success, execution time 0.0 sec | execution_time=0.026 user_time=0.020 system_time=0.010 children_user_time=0.000 children_system_time=0.000 cmk_time_snmp=0.011 cmk_time_agent=-0.010
How would i go about getting the 5 Sec data as an metric?
Hi,
when you will see the result of ino with your pprint function you need the right command for discovery: cmk --debug -vvII … instead of -vv the you will see the result. Otherwise put your pprint in the check function.
Gegards, Christian
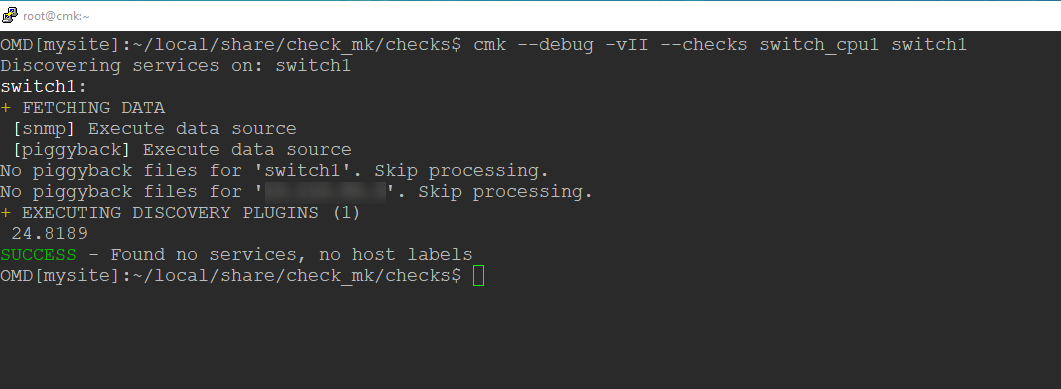
And when doing the: cmk --debug -vII --checks my_netgear_cpu switch1
I get this result:
Discovering services on: switch1
switch1:
+ FETCHING DATA
 [snmp] Execute data source
 [piggyback] Execute data source
No piggyback files for 'switch1'. Skip processing.
No piggyback files for 'IP OF SWITCH'. Skip processing.
+ EXECUTING DISCOVERY PLUGINS (1)
[[u'    5 Secs ( 23.2316%)   60 Secs ( 32.3220%)  300 Secs ( 30.4773%)']]
SUCCESS - Found no services, no host labels
How do i parse the result to get the 5 Sec value? (23.2316%)