We have got a very strange problem after the upgrade to version 2.1 (Enterprise Edition) (first update was from 2.0.0p27 to 2.1.0p7 and today we installed the 2.1.0p9 version). The OS of the servers is CentOS 7.9 with the last patches.
The cpu usage of the “cmc” process increases randomly (after 4, 6, 9 hours) to a very high value: it starts to use the whole processor (the server has 2 virtual processors).
There are no errors in the log files. “strace” has not shown any differences with the other systems.
There are two solutions to lower the cmc process cpu usage:
omd restart site
cmk -R
Has someone obtained a similar problem? Could be a problem with the OS, e.g. systemd?
Nobody with a similar problem?
The system has been moved to a Rocky Linux 8.6 and the problem with cmc high cpu usage is still present. In the cmc log no error messages.
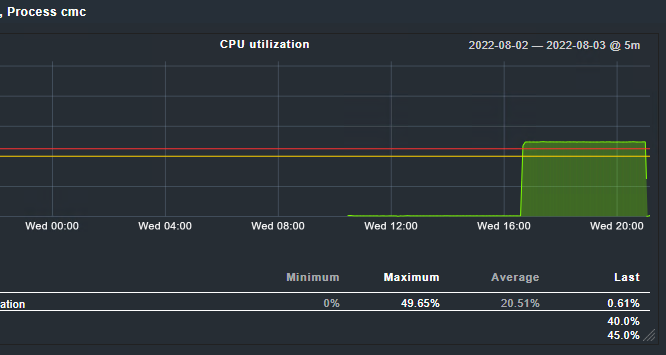
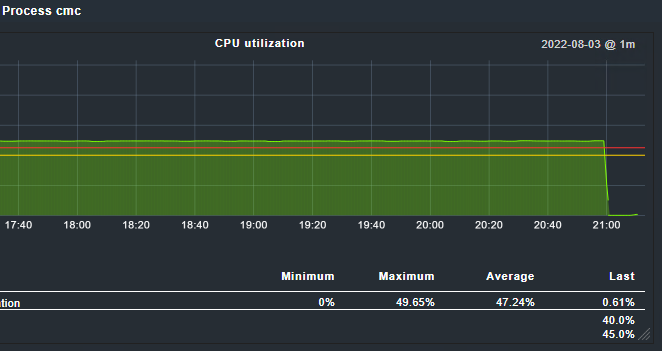
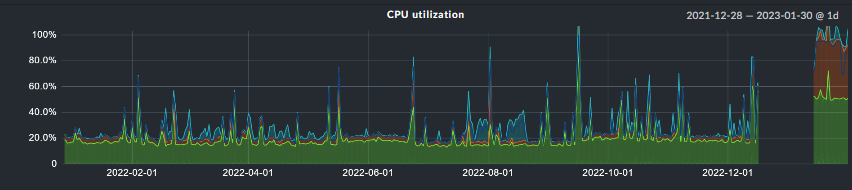
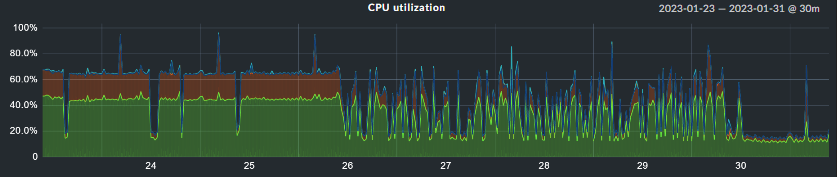
OMD - Open Monitoring Distribution Version 2.1.0p9.cee. The below figure shows the sudden increase of the cmc process cpu usage.
The “cmk -R” command helps:
Does anybody has any advice what should I check, may there be a problem with the configuration?
That is very low assigned resources for such a monitoring system. How many hosts do you monitor?
I have a small system with only 20 hosts and 2 cores and this system has no such problems. Only the base is different than yours with actual Ubuntu/Debian.
It is also strange that after a restart your cmc process needs no resources.
There are ca. 400 hosts and 9500 services. The most strange thing is that the system had no problems before the upgrade with the 2.0.0p16 version. The “cmc” process usually does not consume much cpu resources, a similar system with ca. 800 hosts (ca. 30.000 services), consumes under 5% (but the server has 4 cores).
OK we will try to add 2 cores.
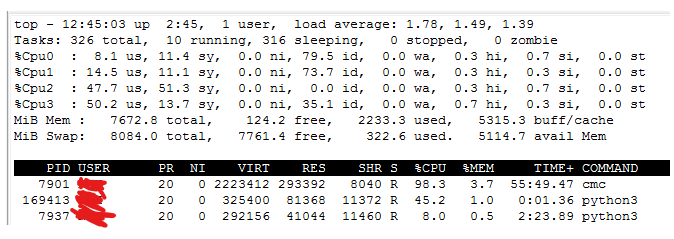
We added 2 cpu cores, however after some time (ca. 1.5h) the cmc process uses again ca. 100% of the one core. Really strange. Interesting is also that the restart of the cmc process “cmk restart cmc” is not enough. Only “cmk -R” or “omd restart siite” commands are able to lower the cpu usage of the cmc process.
Well, I configured the “debug” level for all the cmc core sections. With the script I was able to detect the the exact time when the cpu usage of the cmc process rised to over 90%. It happens really quickly in one second from almost 0% to over 90%. Unfortunately in the cmc.log file there were no unusual messages. Also the amount of the messages did not rise. Really strange, there is no zombie process, the system and Web interface are still very responsive. However I still believe that cmc process should not use the whole core.
There are several ways your configuration can impact the impact of the micro core.
It can be normal, that the core is running with 100% utilization on one CPU core, but that seems unlikely here.
You might want to look for recurring downtimes, if you have a lot of those, they can impact the core.
Thank you Robin for the comment. However, there is no recurring downtime configured. I will check the config in more detail, but it is strange because before the upgrade to 2.1 there was no cmc high cpu usage.
We are facing the same issues on two of our customer sites.
All other sites (roughly 80 total) do not share this behaviour. All of them have been updated from 2.0.0p27 to 2.1.0p9 on Monday & Tuesday.
All of our sites are running inside Docker on Red Hat EL 7.9.
As of now, we have not been able to identify the culprit. Logs are basically “silent”. Restarting the core yields near-0 usage for some time. Then it suddenly spikes to 90% and more again.
EDIT: We do not use recurring downtimes
One site monitors roughly 40 hosts on 2 cores, the other roughly 300 on 2 cores (getting increased to 4 shortly).
I have not read the entire thread, but we are preparing a troubleshooting guide for this in our knowledge base. TL;DR: Deactivate all hosts, restart site and re-enable hosts, until you find one causing the usage.
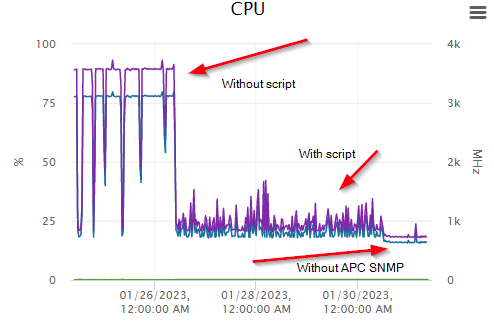
I do not want to blame a vendor here, but we saw this issue with APC devices. Maybe you guys can check, if you have any of those and if disabling them and restarting the site solves the issue.
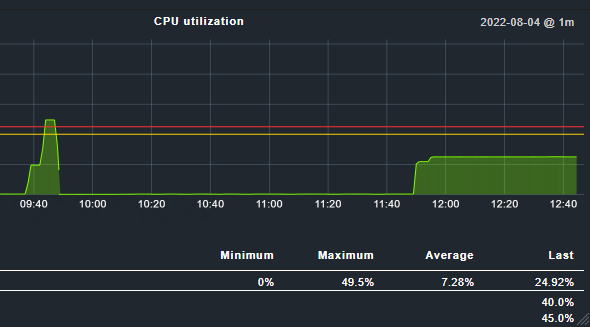
We had the same problem. We upgraded from 2.0.p27 on CentOS 7 to 2.1.p13 on CentOS 7 and then restore configuration to RockyLinux 9.1. Our CPU problem was identical to the OP’s. Im attaching below a screenshot of CPU usage, as u can see on the left there are statistics from CentOS and then a high spike from Rocky.
I will let you know in a couple of days which device is sending the broken SNMP request.
In addition, I want to let you know that from the htop it looked like the CMC process reserved 99%, but each part of the process generally used 0% and then when, for example when data collect from agent, one part of the CMC process wake up for about 10% in couple seconds and then disappeared in queue to take another action. I’m sorry, but I don’t have a screenshot of it.
Thanks for your extensive feedback. We are still looking into the issue, but it is very hard to troubleshoot.
If you can share SNMP walks with me per private message, I will put them into our data pool. If not, that is perfectly OK.
We are investigating anyway.
We just stumbled upon this again on a brand new 2.1.0p26 site.
Here, the behaviour is directly caused by a single APC UPS device that is monitored using SNMPv3. As soon as we disable this host and restart cmc, the load normalizes and does not increase again.
I sent a walk your way @robin.gierse. There are some v3 specific errors in there. Apart from that it looks pretty normal.