Hi,
I’m building custom local check for checkmkv2 to make aspeedtest on top of iperf.
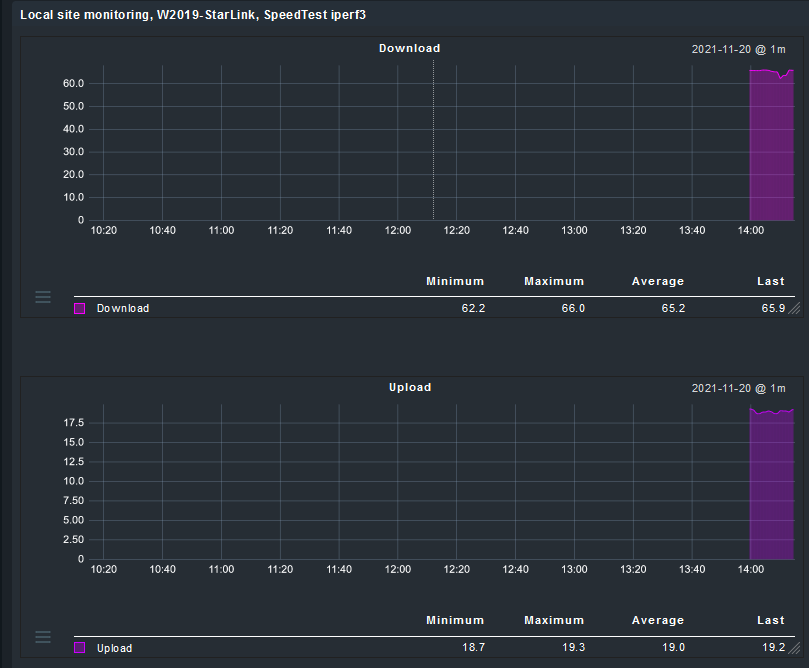
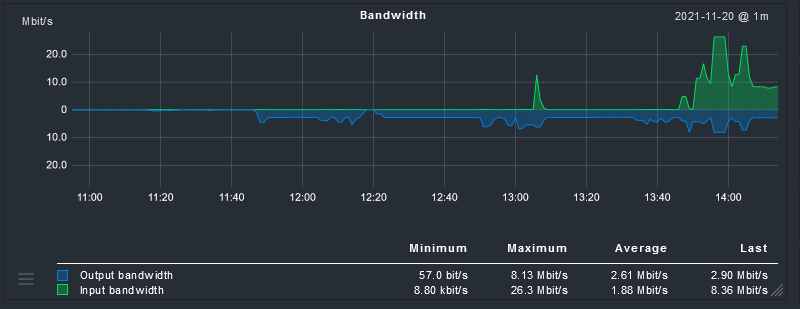
The script from the agents works fine, but I’m wondering how to create on checkmk a single graph to report both value. In most of the “built-in” check like interface bandwidth you can see the same. I would like to create the same with my custom local check.
It would also be good to define your metrics what it is.
As you have Mbits in your output you should also define factors for the correct values in the graph. Normally all traffic values are in bits or bytes per second.
All the definition files should be inside “~/local/share/check_mk/web/plugins/metrics/”.
This topic was automatically closed 365 days after the last reply. New replies are no longer allowed. Contact an admin if you think this should be re-opened.
do you think it is possible to do this in a local check? Or is it mendatory to register an active check for this and write a check plug-in and include your code?