hello team ,
Check Mk version : entrerpise 1.6p.13
I want to perform the monitoring of our openshift / kubernets clusters via check_mk , using prometheus
My use case :
- Monitor global cluster information ( node , pods , service , deployment )
- Monitor specific app inside a POD ( ex : a app inside" jboss running in pod )
- Issues n’ 01
I ve used the datasource as described in https://checkmk.com/cms_monitoring_prometheus.html
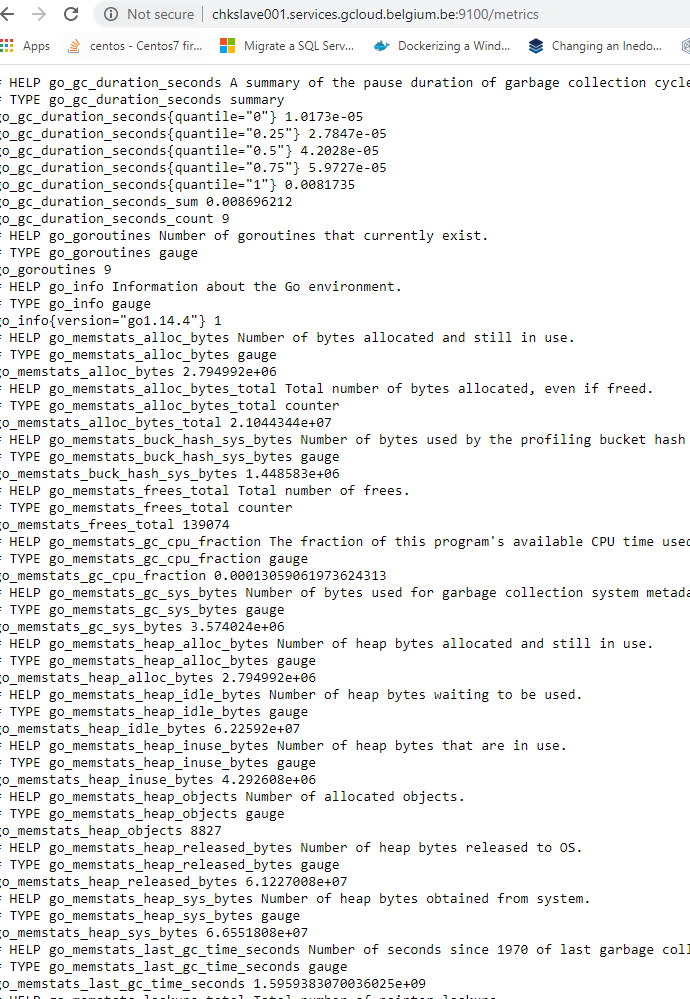
I have single hosts and with prometheus installled + node exporter then I have added this to my check mk , the I’ve configured the prometheus data source , then I got the following error :
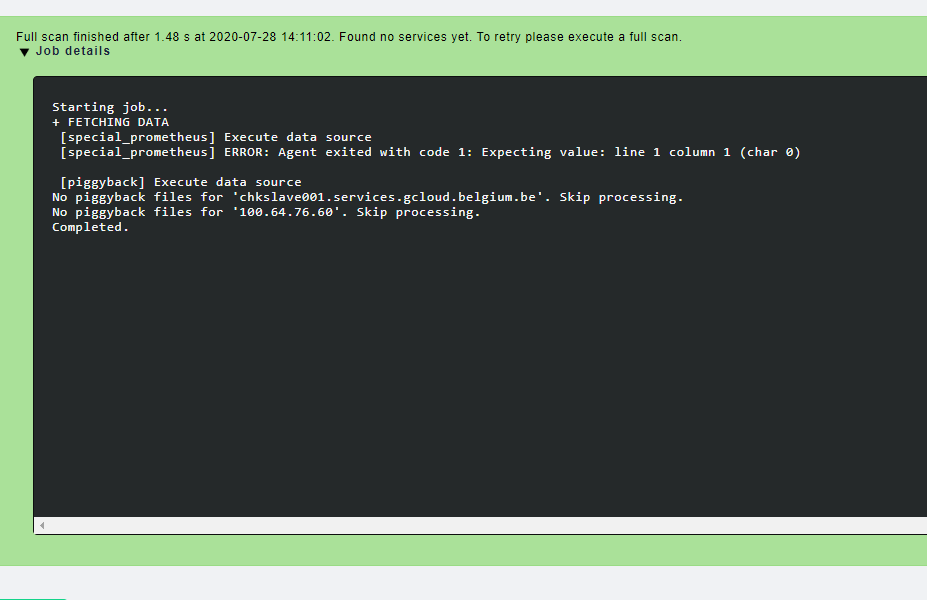
Starting job…
- FETCHING DATA
[special_prometheus] Execute data source
[special_prometheus] ERROR: Agent exited with code 1: Expecting value: line 1 column 1 (char 0)
[piggyback] Execute data source
No piggyback files for ‘myhost’. Skip processing.
No piggyback files for ‘100.64.76.60’. Skip processing.
Completed.
Someone have an idea ?

Kr ,
Andry