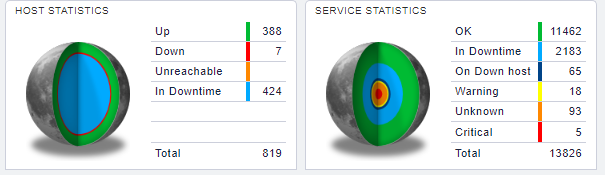
I’m collecting some data via LQ and a bit confused about the different values I get. The dashboard shows:
And LQ shows me:
OMD[test]:~$ lq “GET hosts\nStats: state = 0\nStats: state = 1\nStats: state = 2\nStats: state = 3\nOutputFormat: json”
[[484,323,0,0]]
OMD[test]:~$ lq “GET services\nStats: state = 0\nStats: state = 1\nStats: state = 2\nStats: state = 3\nOutputFormat: json”
[[13222,68,109,375]]
The states are clear:
0 = OK
1 = Warning
2 = Critical
3 = Unknown
So i would expect for example the host request ans return of 388 with the status 0, but it’s 484. Where is my issue here ?
@DanielNunesFerreira
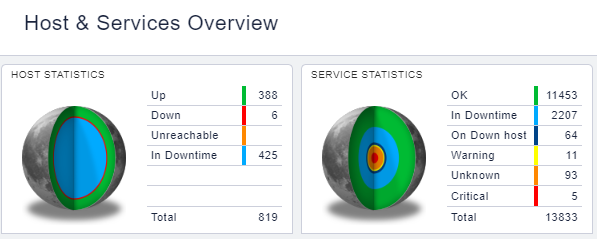
Yes it’s the default dashboard. Nothing changed here. The values in the view “Main overview” are aswell exactly the same.
@ricardoftribeiro
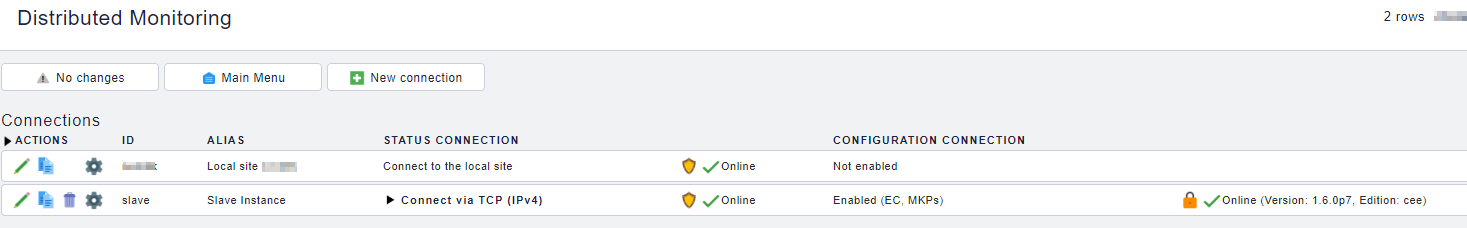
Good hint - we have a 2 node setup, but on the slave there are not that much hosts that this would correct the difference to 388 up hosts.
The values of the EventConsole are correct, just the LQ output seems wrong. So this must be something different
OMD[slave]:~$ lq “GET hosts\nStats: state = 0\nStats: state = 1\nStats: state = 2\nStats: state = 3\nOutputFormat: json”
[[12,0,0,0]]
OMD[slave]:~$ lq “GET services\nStats: state = 0\nStats: state = 1\nStats: state = 2\nStats: state = 3\nOutputFormat: json”
[[47,5,0,0]]
OMD[site]:~$ lq “GET hosts\nStats: state = 0\nStats: state = 1\nStats: state = 2\nStats: state = 3\nOutputFormat: json”
[[485,322,0,0]]
OMD[site]:~$ lq “GET services\nStats: state = 0\nStats: state = 1\nStats: state = 2\nStats: state = 3\nStats: state = 4\nStats: state = 5\nOutputFormat: json”
[[13243,58,105,375,0,0]]
If you are querying the LQ you get all hosts. If you are logged in to the webpage and have hit the option Only show hosts and services the user is a contact for (at the user settings lower left corner, or set by admin) or a limited access to hosts, you only get the hosts you are allowed for at the tactical overview or you dashbord snapins.
Checked that too, its not activated and i’m sure that the values in the webpage are correct.
I’m slowly getting to it. In LQ per default hosts/services which are in downtime are aswell counted. But this does not happen in the webpage, there are things in downtime separated.
Overview: Get all Hosts in Downtime (correct): OMD[site]:~$ lq "GET hosts\nStats: scheduled_downtime_depth > 0\n\nOutputFormat: json"
425
Get Sum of all Hosts without Hosts in Downtime: OMD[site]:~$ lq "GET hosts\nStats: state = 0\nStats: state = 1\nStats: state = 2\nFilter: scheduled_downtime_depth = 0\nOutputFormat: json"
[[378,3,0]]
mhh - does not match. Okay, seems like lq calls only the numbers by one monitoring site (and not another distributed site) OMD[slave]:~$ lq "GET hosts\nStats: state = 0\nStats: state = 1\nFilter: scheduled_downtime_depth = 0\nOutputFormat: json"
[[12,0]]
378 + 12 = 390 - Correct
Get all Services without Downtimes:
OMD[site]:~$ lq “GET services\nStats: state = 0\nStats: state = 1\nStats: state = 2\nStats: state = 3\nFilter: scheduled_downtime_depth = 0\nOutputFormat: json”
[[12945,56,103,374]] add those from the distributed monitoring site: OMD[slave]:~$ lq "GET services\nStats: state = 0\nStats: state = 1\nStats: state = 2\nStats: state = 3\nFilter: scheduled_downtime_depth = 0\nOutputFormat: json"
[[47,5,0,0]]
Checking for services: OMD[site]:~$ lq "GET services\nStats: state = 0\nStats: state = 1\nStats: state = 2\nStats: state = 3\nFilter: scheduled_downtime_depth = 0\nOutputFormat: json"
[[12945,56,103,374]]
Okay that value is still to high, I guess we have to exclude services which are ok, but on a host in downtime. OMD[site]:~$ lq "GET services\nStats: state = 0\nStats: state = 1\nStats: state = 2\nStats: state = 3\nFilter: scheduled_downtime_depth = 0\nFilter: host_scheduled_downtime_depth = 0\nOutputFormat: json"
[[11498,5,12,93]]
That values sound almost the same from the webgui