Checkmk is only generating IKE and IPSec graphs.
By SA you mean a single IPSec/Phase II/Data SA associated with a VPN tunnel I guess.
You can’t. Right now you get only a summary for all the IPSec SAs associated with the VPN tunnel. So you should get this prefdata for the IPSec SAs:
- IPSec active time (s)
- IPSec Bytes in (byte/s)
- IPSec Bytes out (byte/s)
- IPSec packets in (/s)
- IPSec packets out (/s)
- IPSec packets dropped in (/s)
- IPSec packets dropped out (/s)
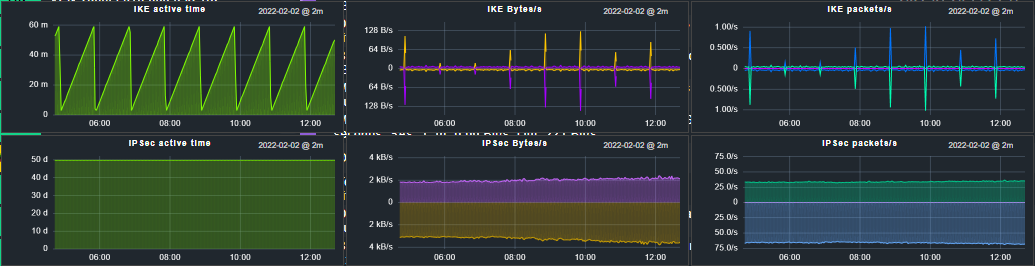
Sorry I didn’t make you properly. SNMP is collecting attributes of IKE, IPSec and SA. By default I am seeing the IKE and IPSec graph with the values which it is collecting. But SA graph is not available by default as per above screenshot I have provided. Please check that IKE, IPSec and SA values are present in the below screenshot.
![]()
Do you mean a graph for the number of IPsec SAs? There is none.
Yes I meant the IPSec SAs graph and I am not seeing this. Is there any way to create this graph?
there is no graph for this, right now.
Hi,
I am having simular problems with our Cisco CSR1000v routers. I have sent an email with the requested info for contribution. Hope that you have the time to look into it.
Might be a firmware issue, we have some CSR1000v running firmware Version 17.2.2 and they seem to be working.
But a CSR1000v running firmware Version 16.12.4 does not provide the needed OID. I will try to firmware update the old one and see if that fixes it. ![]()
@beermann got your message. Unfortunately, the router does not deliver the needed OIDs ![]()
.1.3.6.1.4.1.9.9.171.1.2.3.1 = No Such Object available on this agent at this OID
.1.3.6.1.4.1.9.9.171.1.3.2.1 = No Such Object available on this agent at this OID
There are only global statistics available. Like cikeGlobalActiveTunnels, cikeGlobalInOctets … and so on.
so this check will not work for this kind of router.
sorry
Thomas
Hi, I tried install thl-cmk vpn plugin and when I try reload cmk, then I get error
OMD[test01]:~$ cmk -Rvv --debug
Legacy check plugin still exists for check plugin cisco_vpn_tunnel. Please remove legacy plugin.
Traceback (most recent call last):
  File "/omd/sites/test01/lib/python3/cmk/base/config.py", line 2045, in _extract_check_plugins
    raise ValueError(
ValueError: Legacy check plugin still exists for check plugin cisco_vpn_tunnel. Please remove legacy plugin.

The above exception was the direct cause of the following exception:

Traceback (most recent call last):
  File "/omd/sites/test01/bin/cmk", line 79, in <module>
    errors = config.load_all_agent_based_plugins(check_api.get_check_api_context)
  File "/omd/sites/test01/lib/python3/cmk/base/config.py", line 1428, in load_all_agent_based_plugins
    errors.extend(load_checks(get_check_api_context, filelist))
  File "/omd/sites/test01/lib/python3/cmk/base/config.py", line 1577, in load_checks
    _extract_check_plugins(validate_creation_kwargs=did_compile))
  File "/omd/sites/test01/lib/python3/cmk/base/config.py", line 2061, in _extract_check_plugins
    raise MKGeneralException(exc) from exc
cmk.utils.exceptions.MKGeneralException: Legacy check plugin still exists for check plugin cisco_vpn_tunnel. Please remove legacy plugin.
Can you help me please?
Version: 2.0.0p21 (CEE)
@MirekLama can you please open a separate toppic for this, as this toppic I already solved?
@thl-cmk Sorry, my mistake, I will open new topic for this. Thank you for your reply.
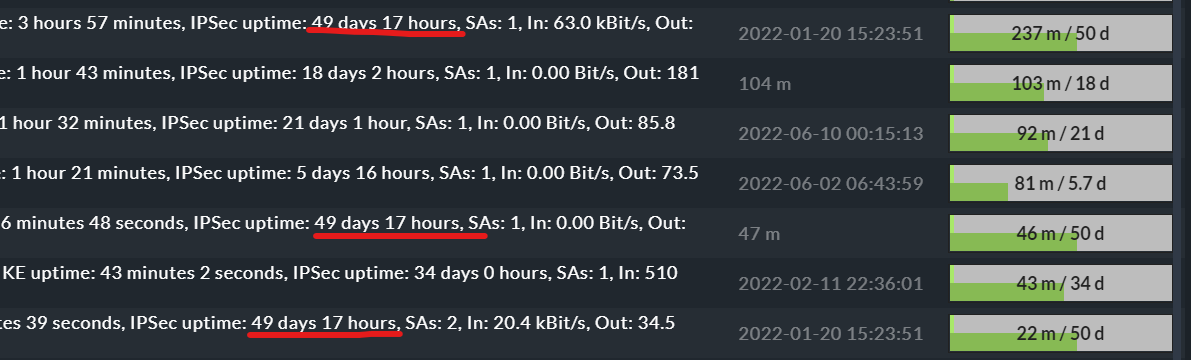
@thl-cmk brother… There is another issue I am observing about tunnel uptime. When uptime crosses 50 days then it doesn’t show more than 50 days. The value stuck in 49 days 17 hours. Here is the screenshot.
@shafiullah can you please open an new toppic for this, and then provide the OID from your device?
1.3.6.1.4.1.9.9.171.1.3.2.1.10 # cipSecTunActiveTime
Ok brother. I have raised a topic about [Cisco VPN Tunnel showing wrong uptime].