does anybody have or know a good check_mk/nagios/icinga compatible check in combination with the tool “pflogsumm” (which gives out pretty nice statistics, but is missing the “make-output-nagios-compatible switch” which we know from needrestart -p etc.)?
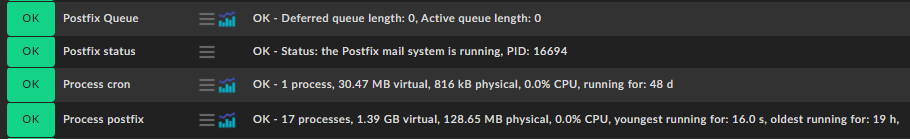
I would like to get more out of my postfix than just
I have created a little python script, i put it under local/86400 so it runs every 24 hours. The pflogsumm command got the parameter -d yesterday. Unfortunately you cannot give the pflogsumm a time range, so that it’s more flexible.
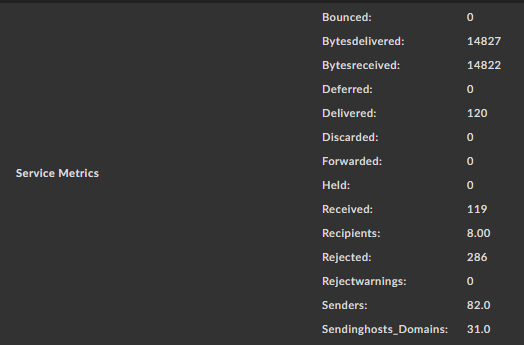
The service metrics look like this:
The next steps will be to give each metric some proper min/max thresholds, since i used check_mk’s output format to change states by perfdata.
So I could need some input what great default thresholds for those metric could be. For the warnings it’s easy, but what about the rest…
PS: How can I make sure that some values are definitely int and not float. To me it looks like it’s a random choice made by pnp4nagios?!
This topic was automatically closed 365 days after the last reply. New replies are no longer allowed. Contact @fayepal if you think this should be re-opened.