Hi All,
I have rule which will alert me if the uptime is less than 10 minutes show as critical ( to indicate a server has rebooted was my thinking behind this rule) This is working fine and i receive the email notification.
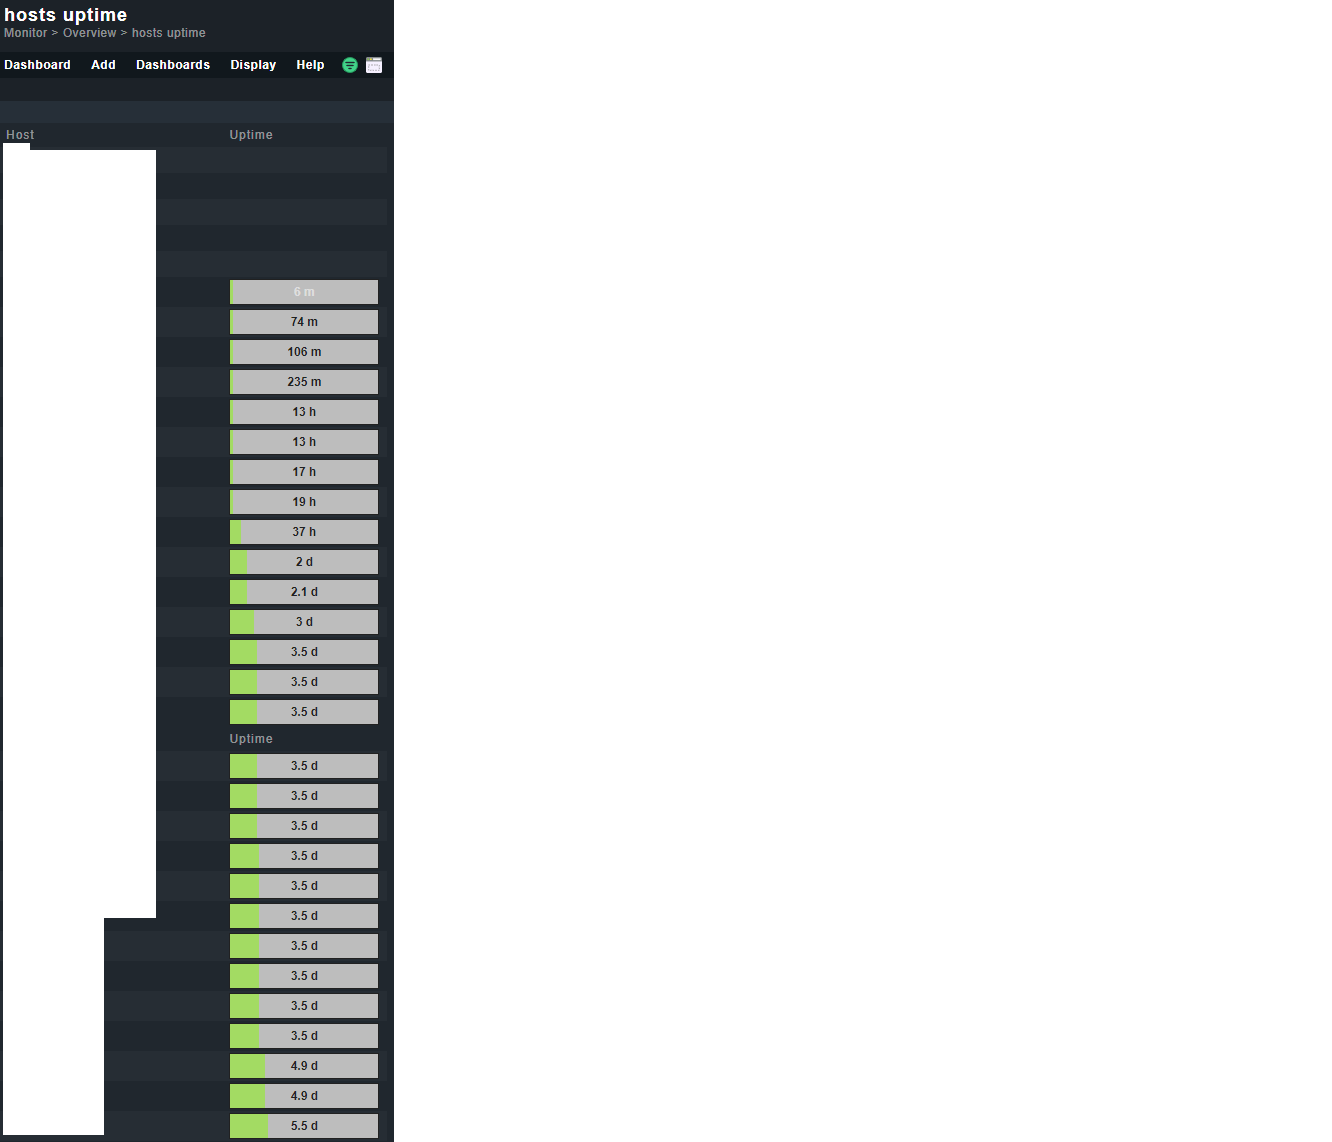
Is there a way to create a dashboard / report against a rule? ruleID, for example i want a view / report that will tell me of servers with an uptime of <24 hours for all hosts in the main folder. So anything that has hit ruleID 1234 in the past 24 hours show me kind of thing.
The problem i think i am having, is that the uptime returns to OK after 10 minutes, so it will not show in a dashboard view, or i can’t get it too.
The only alternative way i can think of is, is it possible to create a dashboard / report that runs against notifications which i can then tweak / filter down to potentially achieve the output i desire?
I can change views and filters to achieve close to what i am after but as soon as i add it to a dashboard it appears not to keep the filter, or translate over correctly.
Did a search on here, but majority of post seem to be relating to the reporting in checkMK not being that great! i will keep messing around for now.