Just a long shot. Never tried it myself, so I can’t be of more help, but maybe you can try integrating with Grafana: https://checkmk.com/cms_grafana.html
What exactly do you want to achieve with the search?
Something like - all services with name “X” and all performance values starting with “load” ?
If you mean such a procedure than i only can say not possible at the moment.
With the combined graph feature only the possibility to filter for specific performance values is missing.
All CPU load from a search combined in a graph is working but not only the load5 or load15 check_mk/combined_graphs.py?datasource=services&filled_in=filter&presentation=lines&service_regex=CPU+load&view_name=searchsvc&view_title=CPUload
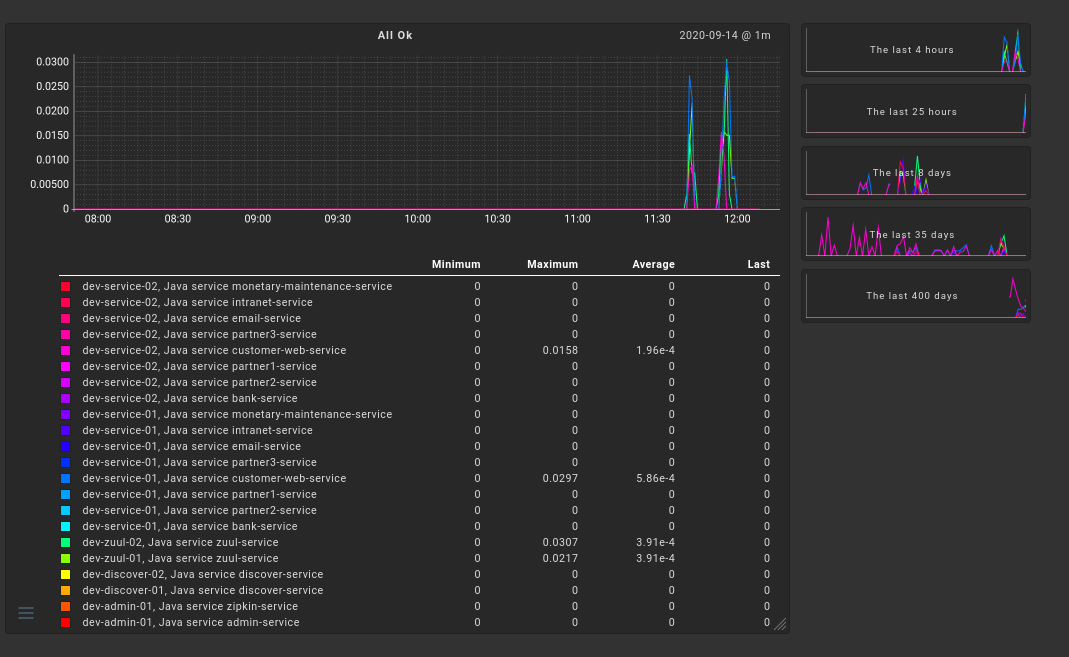
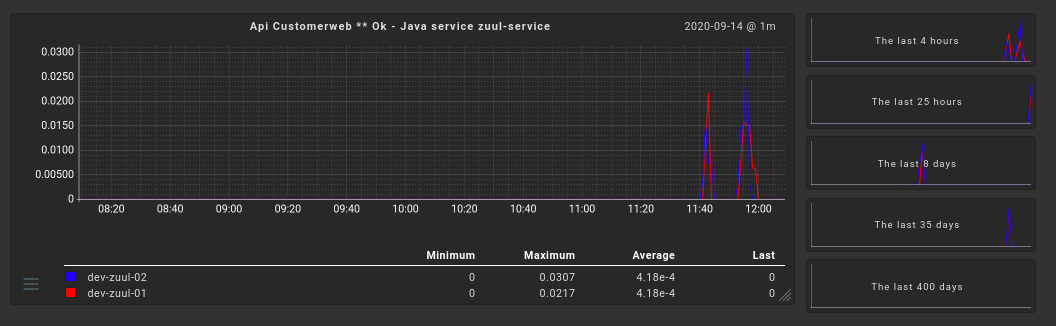
We have a custom service that exposes Springboot2 http metrics by endpoint. So, for a particular “service”, there are multiple graphs for all the endpoints.
There is an “All_Ok” graph for every service and an “All_Fail” graphs for every service which encompasses the counts for all the endpoint of the service. So, while we can do a search for graphs that gets all of the graphs, it’s large. And though we can do things like Combined Graphs from the search result (to combine the All_Ok and All_Fail), the somewhat unique endpoint graphs remain.