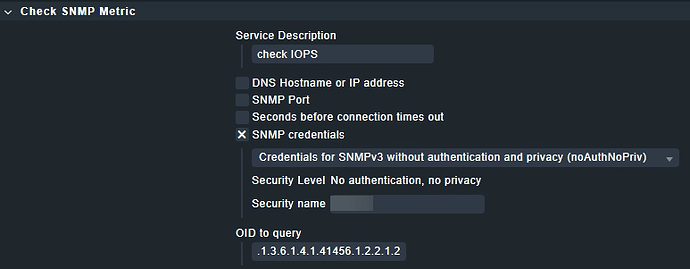
Hi,
i have a running service that collects some performance counter using SNMP.

No I’d like to put that performance data into a graph.
What would be the best way to accomplish that?
I tried, using a custom graph, but when I select the appropriate service, it can’t find metrics in there… Which is probably, because the data is either just text or in best case an array.
Would I have to write something like that, for every item?
def check_aruba_md_memory(section):
   for item in section["RAM"]:
       for key in section["RAM"][item]:
           yield from check_levels(
               value=float(key),
               label='Used',
               boundaries=(0,100),
               metric_name='Memory',
               levels_upper=(74, 89),
               render_func=render.percent,
           )
Or is there another better option to write each of these items into graps
found in - Personnel plugin SNMP GRAPH auto generate - #4 by Xoma
I also found there is an option with some Extention plugin just requesting single SNMP OIDs.
But for some reason, although that service in linked to the host, it’s not registered as a actual service within the host…
Would that be a better way getting data into graphs?
If, what is missing to make that service running?
CMK version:2.3
OS version:1.7
THANKS!
