First check if the “mkeventd” service is running with “omd status”.
The documentation shows the screenshots and steps for the current production version 1.6
With your beta of 2.0 it is a little bit different.
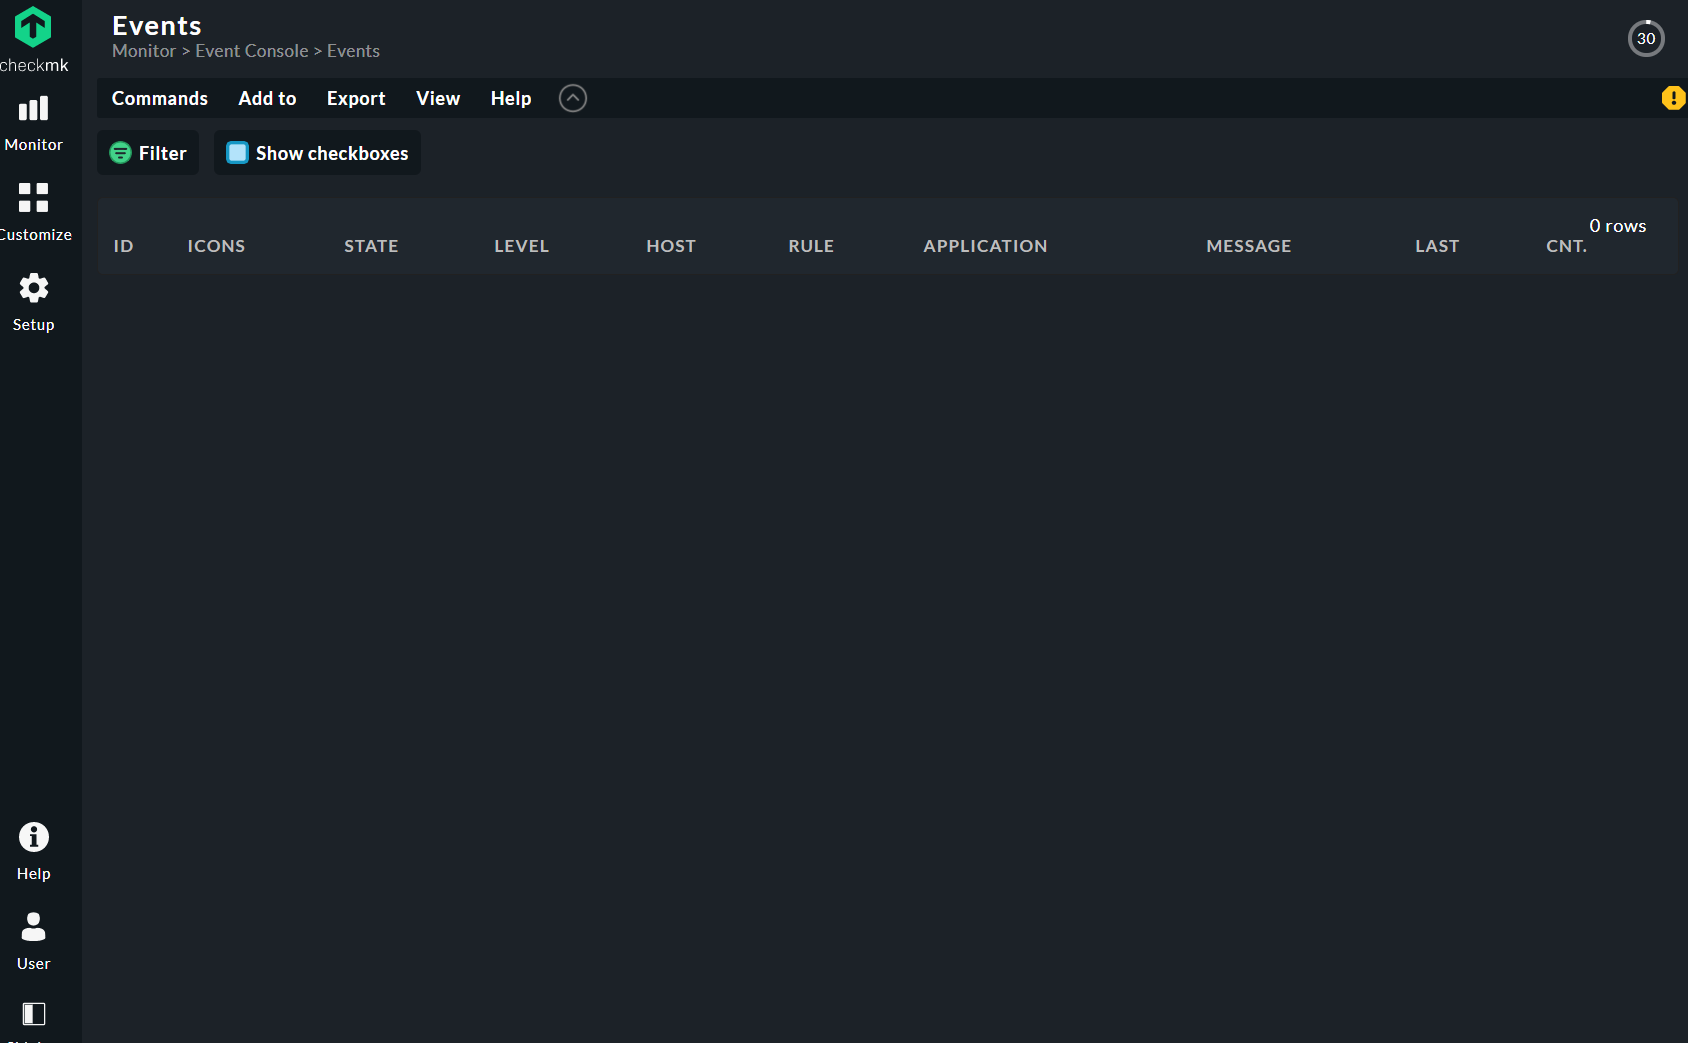
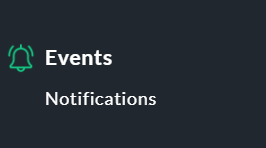
On the left side go to “Monitor” and there to “Event Console” - “Events”
You should see an empty view. If this is there then your “Event Console” is working.
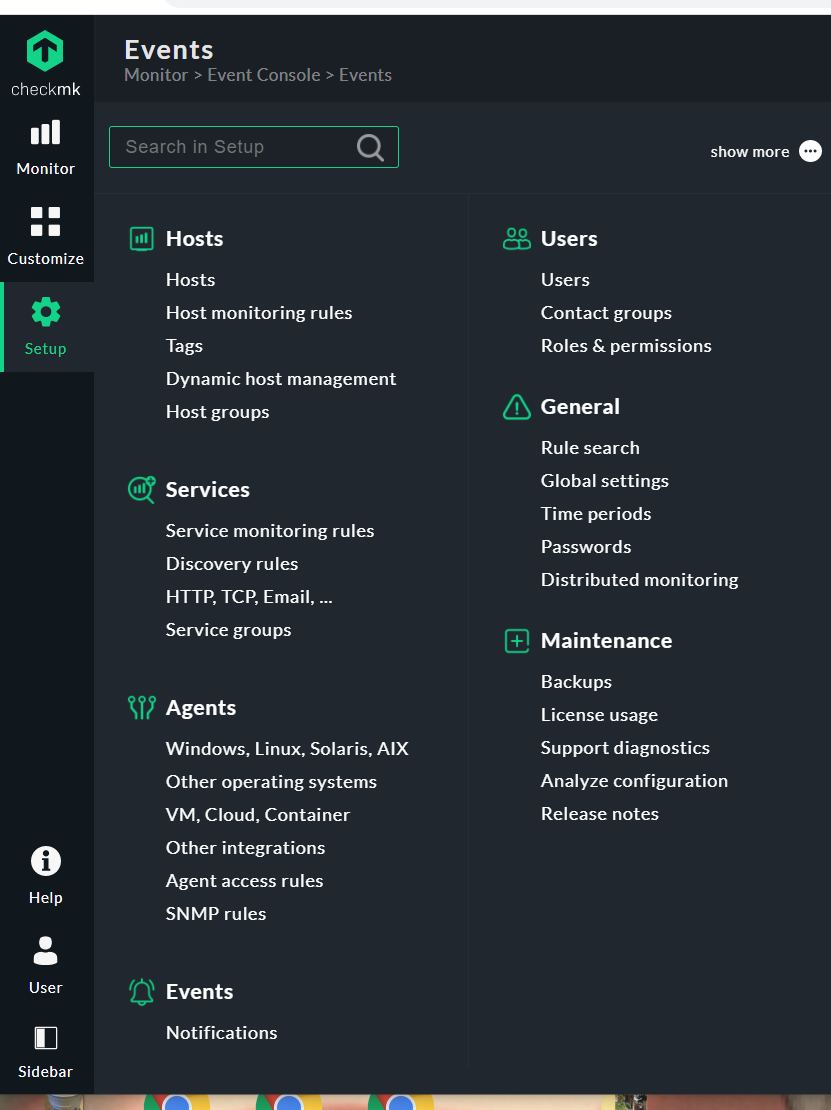
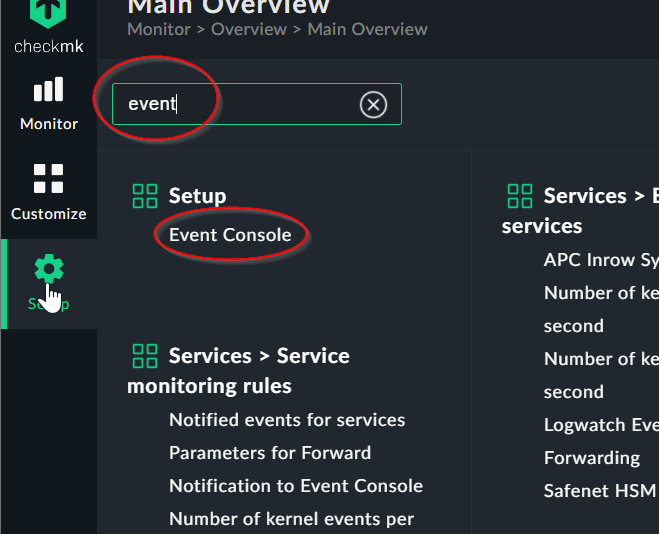
Now you can use the “Setup” button and use the search field there with “event” as search term. On the top should be “Setup” - “Event Console”.
From there you can use the manual to setup some rules.
I’ve tried my best and spend 2 hours reading most of each heading and can’t find one related to SNMP traps? if you mean under SNMP Rules, can you share the next step as nothing jumps out for setting rules for what should be monitored?
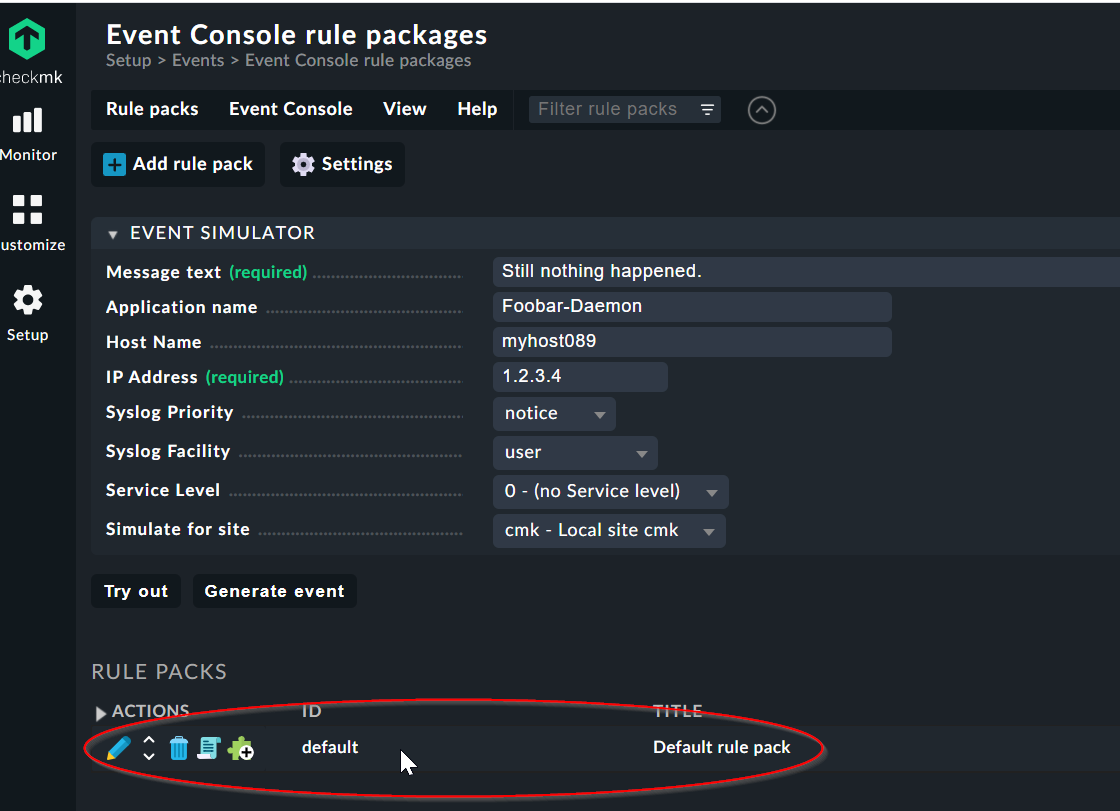
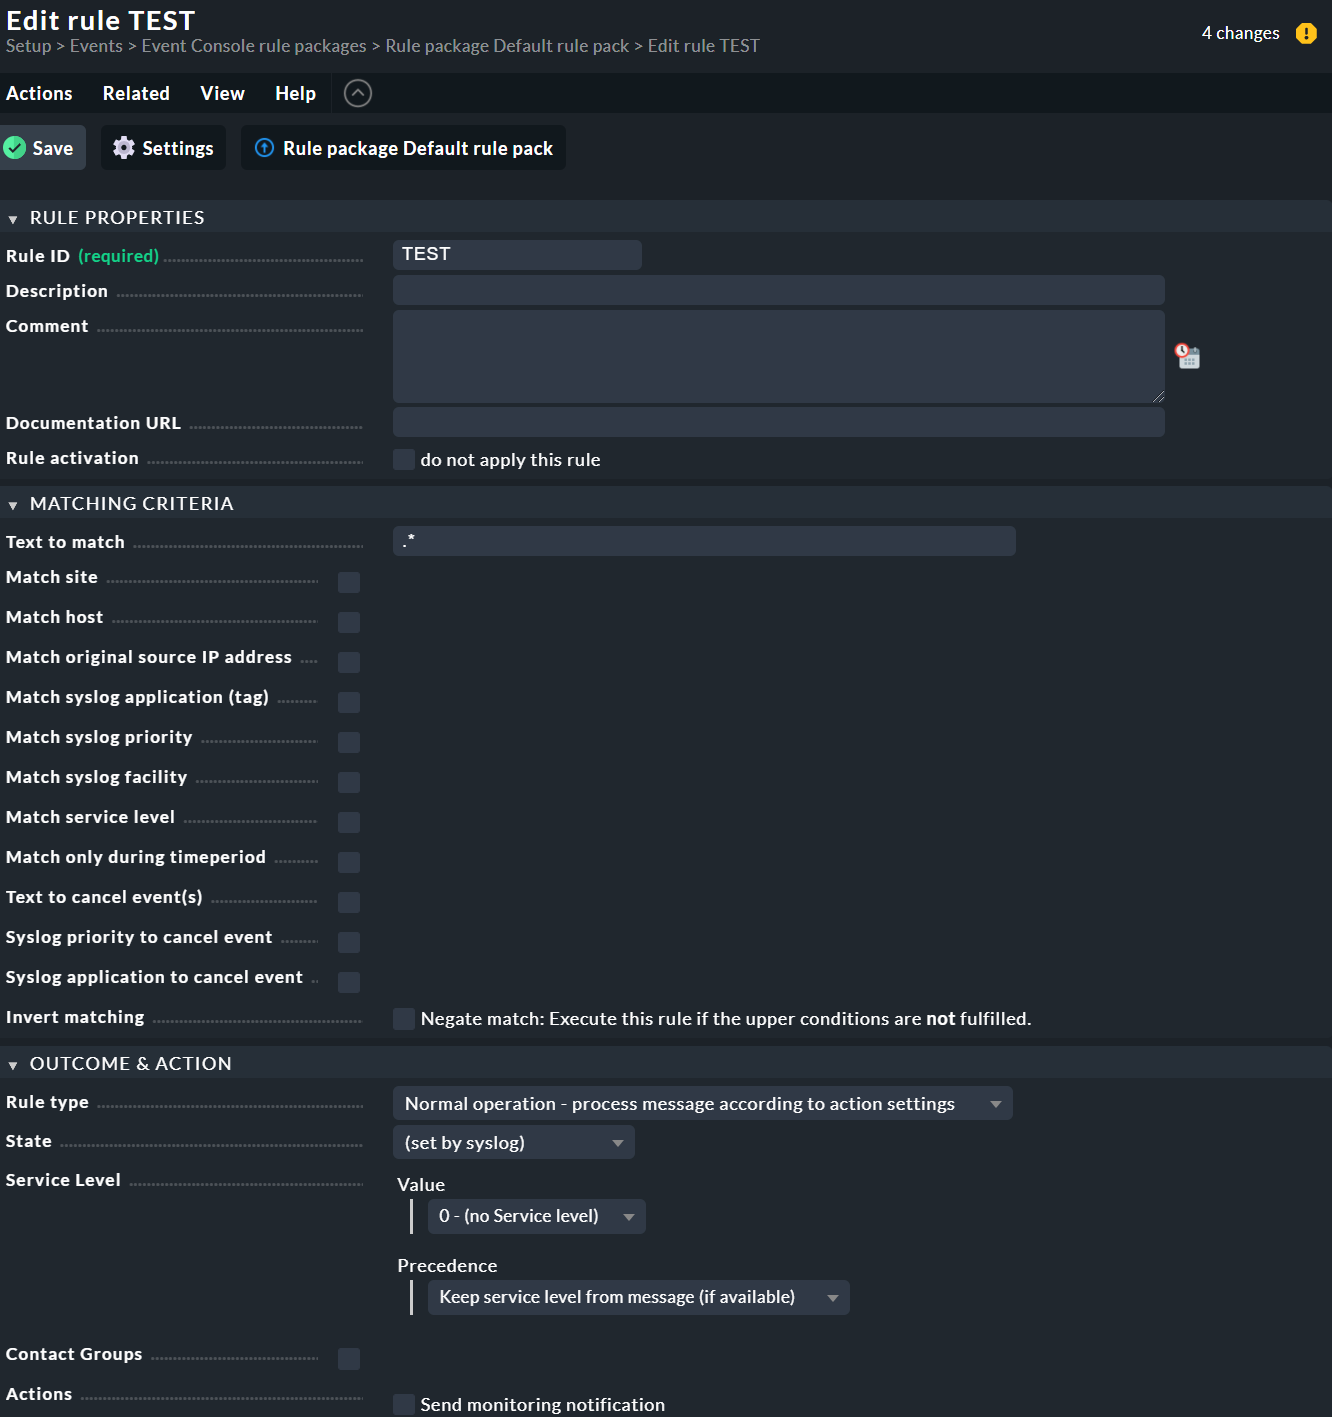
Inside the rule pack you can define some rule for the events processed.
For the system it is no difference if it is a SNMP trap or some other event received.
The “Default rule pack” is empty at the start.
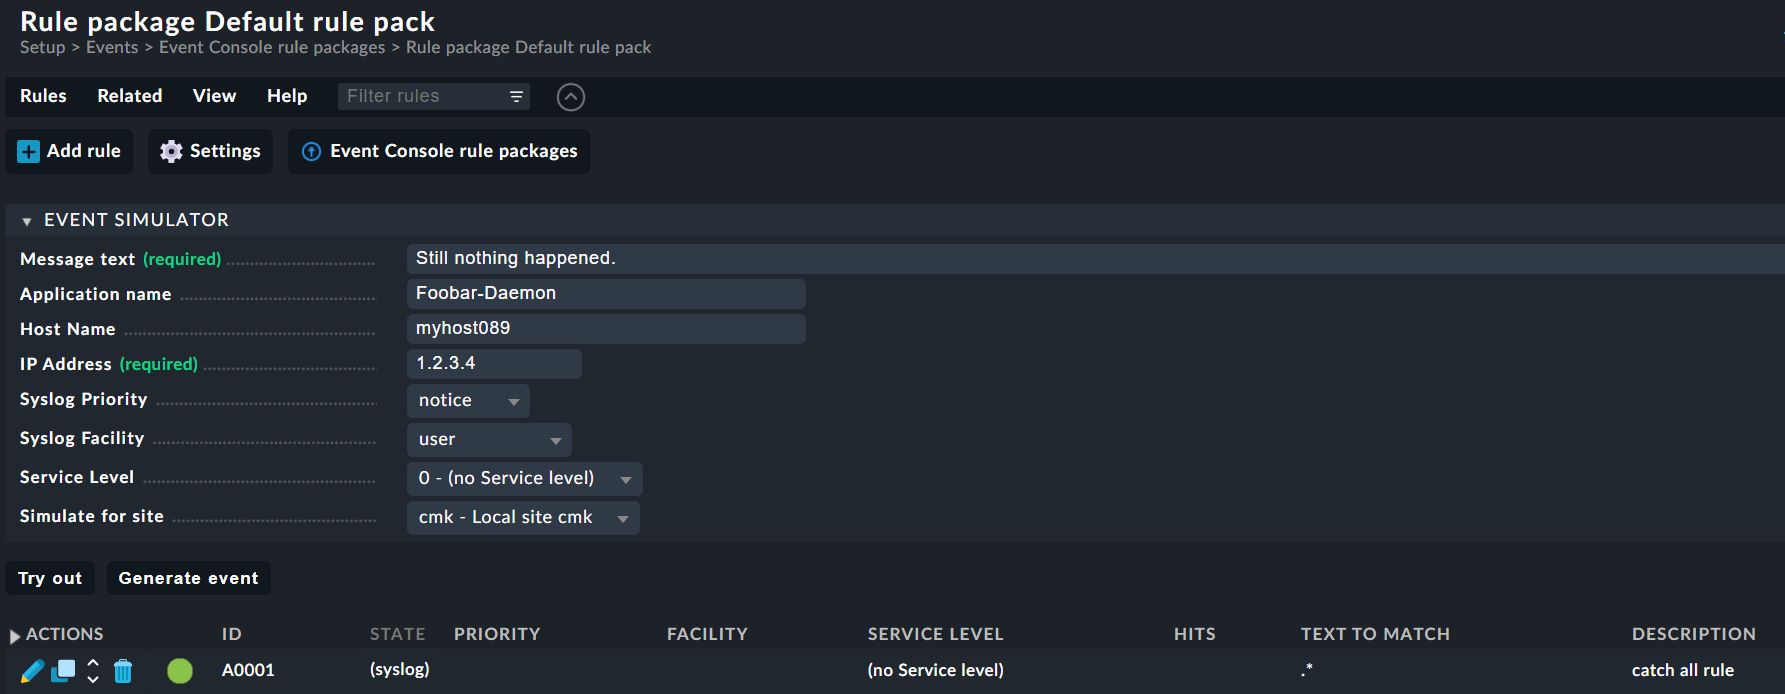
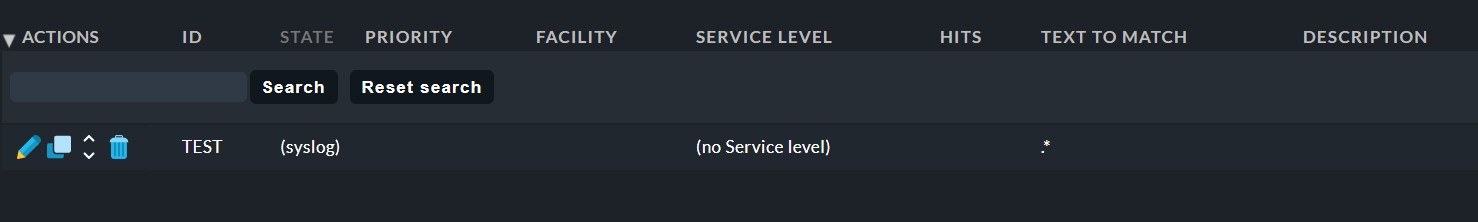
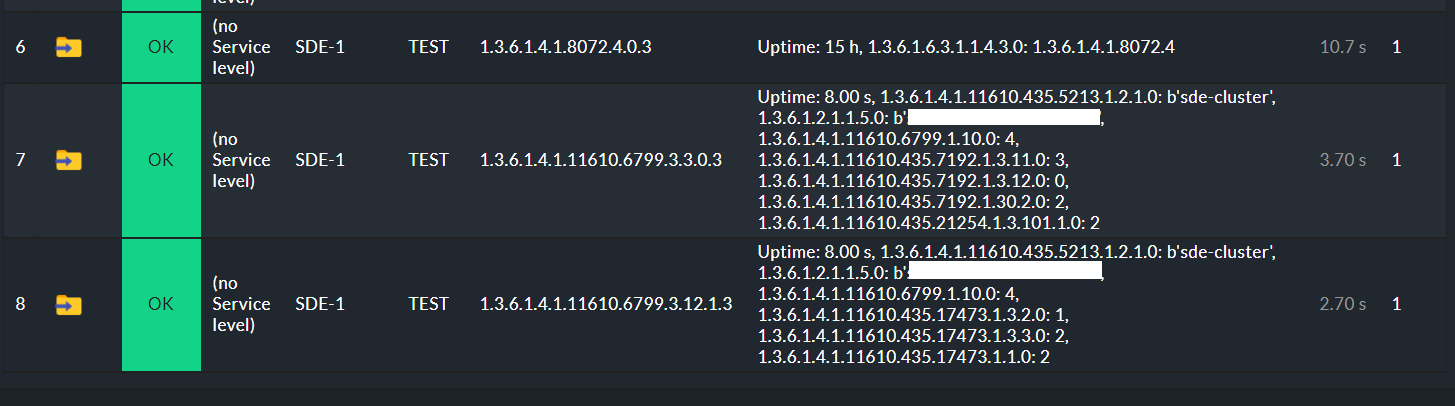
If you insert there only one rule with “Text to match” set to “.*” then it will catch all events received. With this rule you can inspect if there are some events or traps are received.
Will look like this.
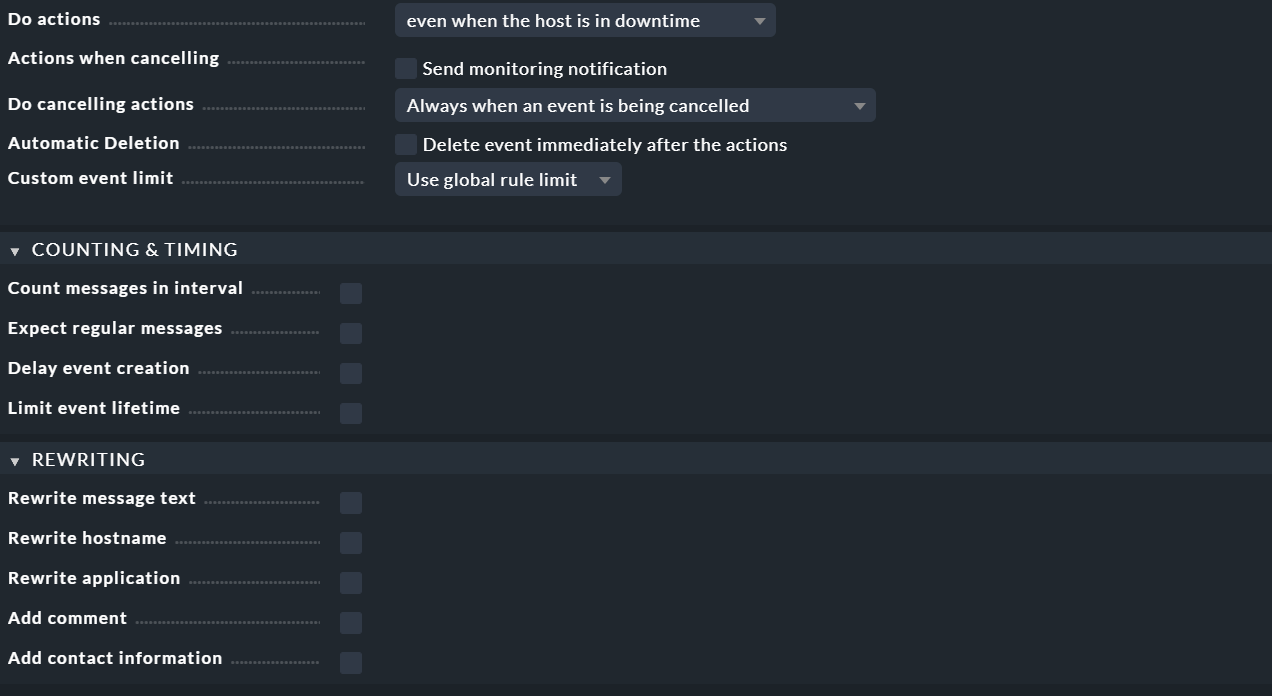
Here is the full “Rule” with options available. I’m missing where to configure the SNMP, I would expect to see the OID / MIB relation or what may be called " Service " to associate?
Guessing here, i would suspect the “SNMP TRAP listener is writing to syslog”? then we use this to parse the syslog? <-- Am i in the ballpark for understanding?
This topic was automatically closed 365 days after the last reply. New replies are no longer allowed. Contact @fayepal if you think this should be re-opened.