Hi,
I’d like to show top 10 devices that have the highest CPU utilization into our dashboard.
You can add it only for a single host (you need to apply an filter).
Hi,
I’d like to show top 10 devices that have the highest CPU utilization into our dashboard.
You can add it only for a single host (you need to apply an filter).
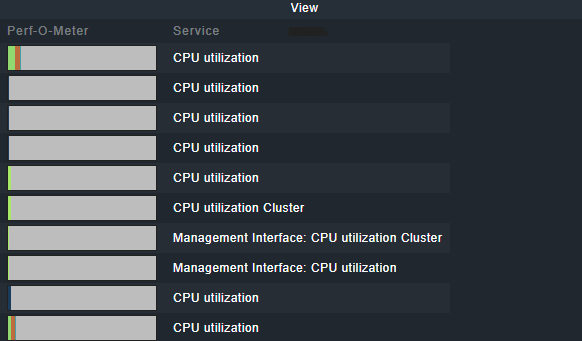
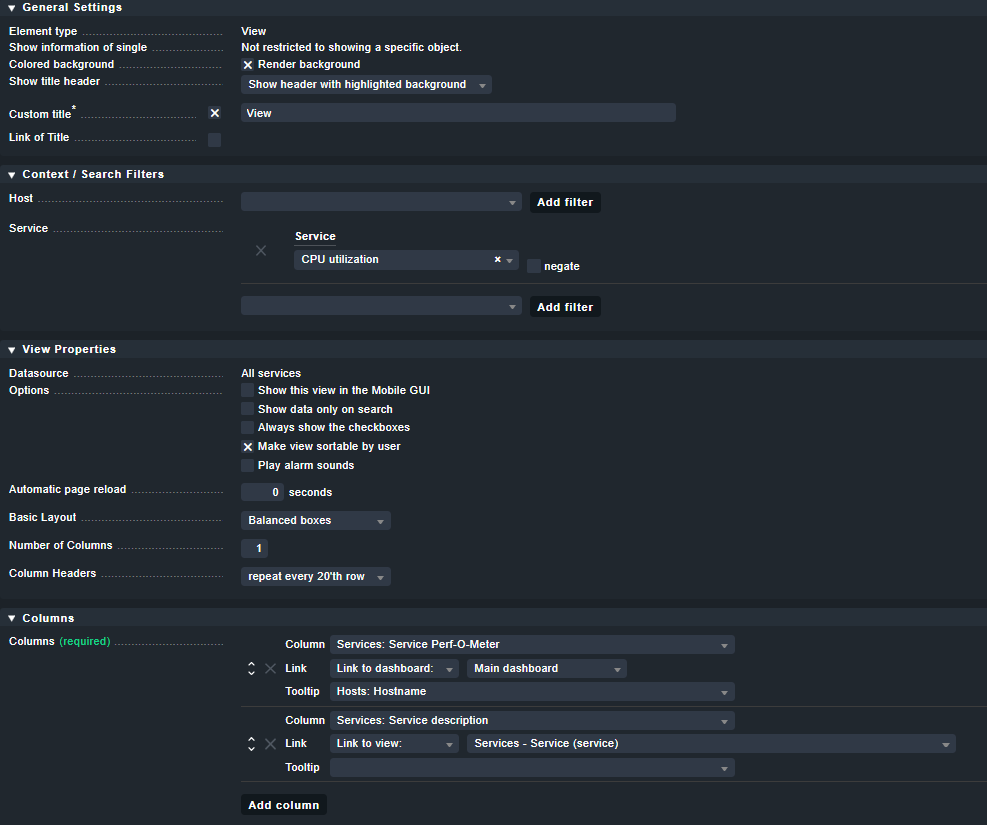
You can create a view and add the Perf-O-Meter for CPU utilization to it. Then you can sort using that.
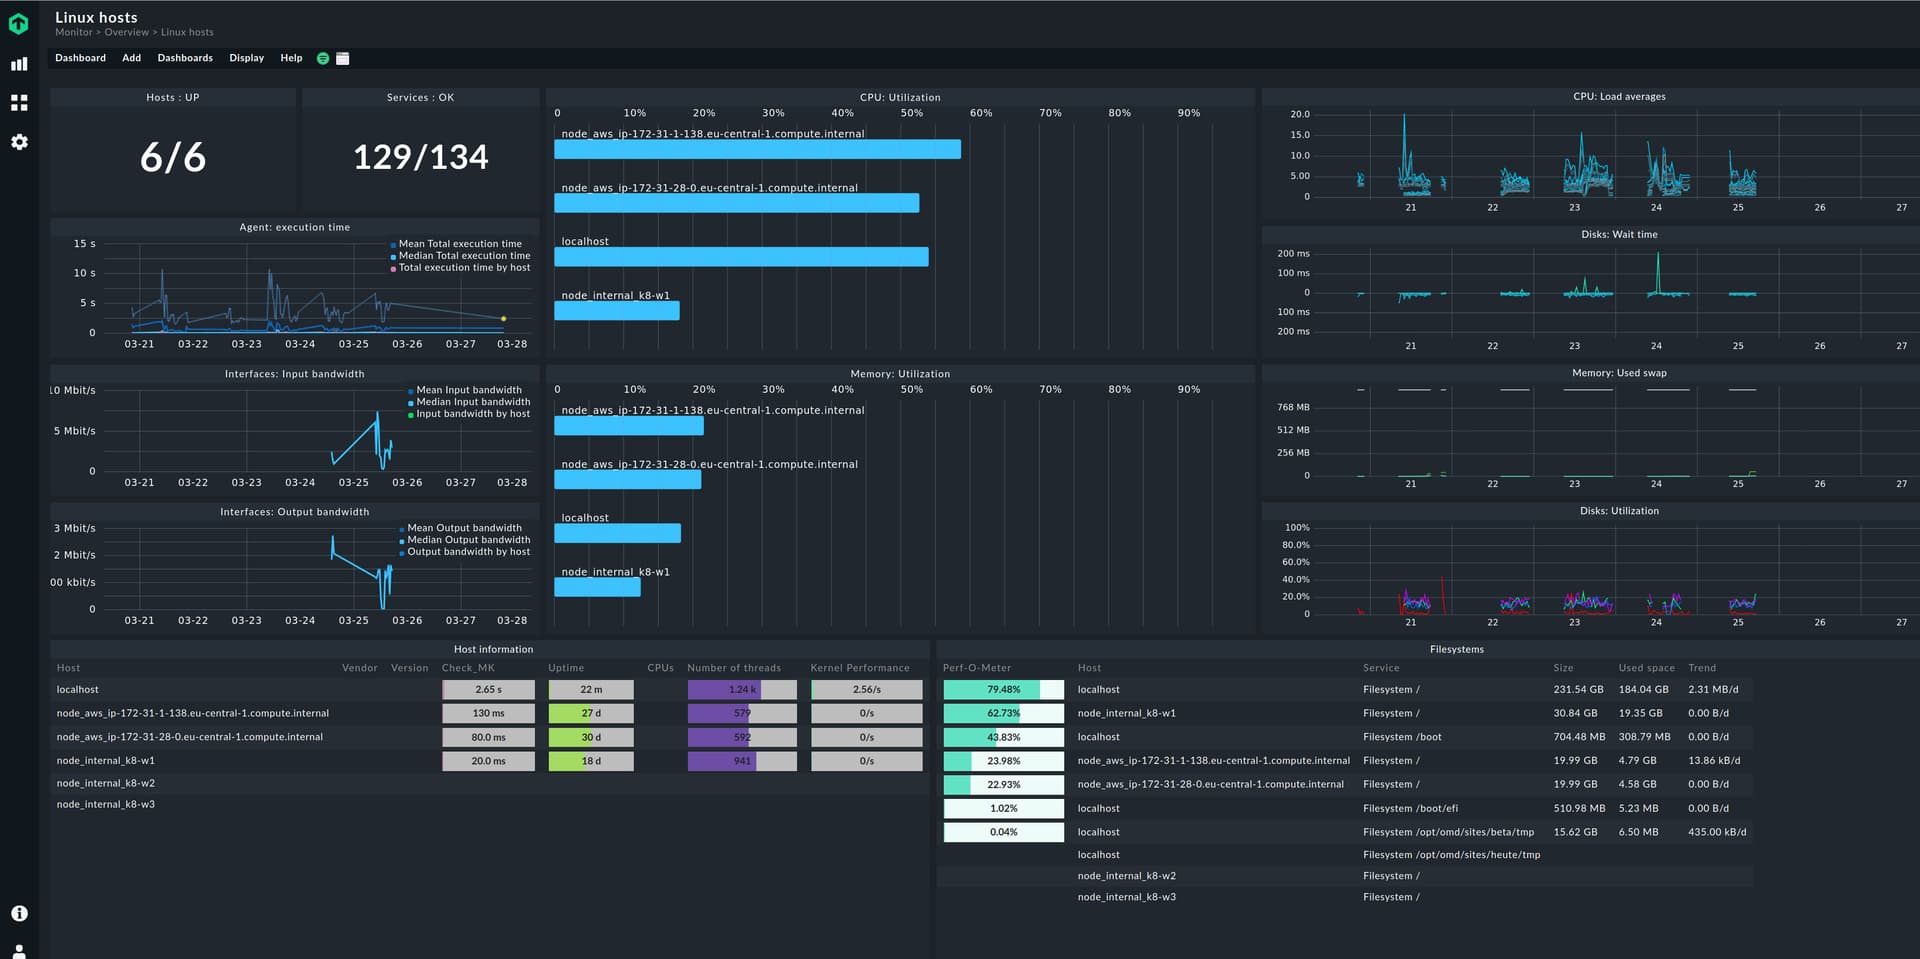
In 2.1 in the Enterprise Edition, you will find Linux dashboards built-in, which use that feature for filesystems. You can take a look at them and copy them and adapt them to your needs.
How do I add the Perf-O-Meter to the dasboard? Can’t find it under the metrics.
Already found it! Thanks!
Is there also an possibility to change the time interval from 4 hours to 2?
I only can get it as a Barplot.
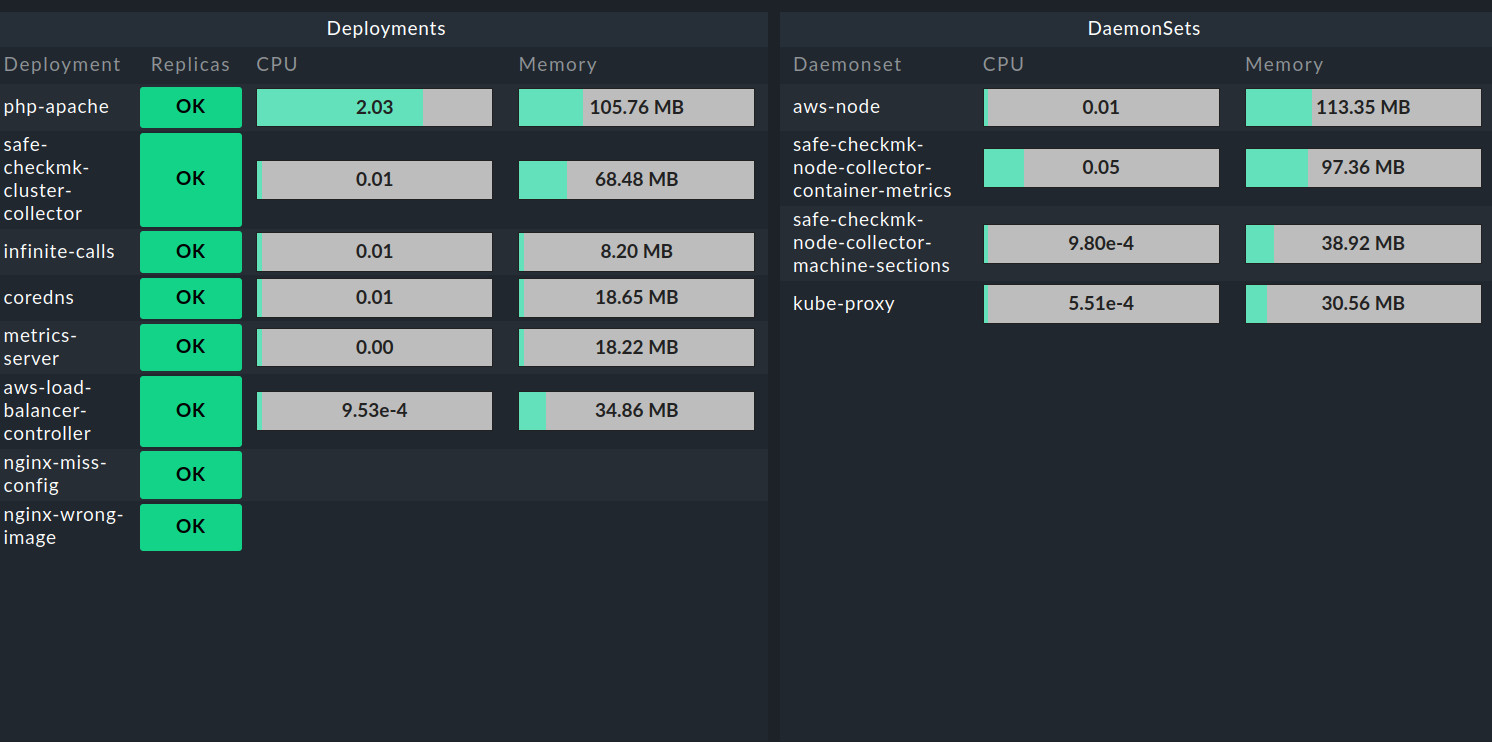
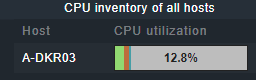
This is what I’ve got now:
This topic was automatically closed 365 days after the last reply. New replies are no longer allowed. Contact an admin if you think this should be re-opened.