Hi,
thanks for the hints.
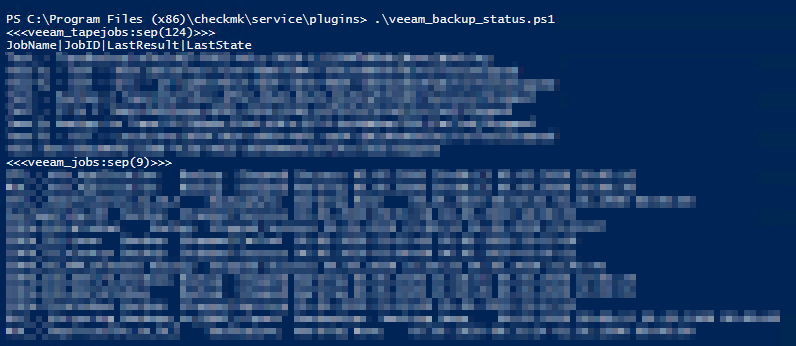
So Plugin output manually added does not have a debug level:
JobName|JobID|LastResult|LastState
XXXXX |af4c5dd7-f602-46cc-9919-112198fb88ab|None|Idle
XXXXX |d53af723-7c76-4b86-b947-3752e96935fd|Failed|Stopped
XXXXX |a6fcf07d-7bef-467b-9005-4649a2010fab|Failed|Stopped
XXXXX |5627c6cc-df62-46e0-91e9-54d3caf76105|Success|Stopped
XXXXX |de94baea-dd91-495d-8164-63f97b3742a0|Failed|Stopped
XXXXX |317f6bda-f2e6-40fe-9753-6c8db8ae7205|Failed|Stopped
XXXXX |df6f3814-a609-44f1-ae9f-8b2d8ed88241|Failed|Stopped
XXXXX |e0ad904a-cd68-4c2b-99c2-d679860f5327|Failed|Stopped
<<<veeam_jobs:sep(9)>>>
XXXXX Backup Stopped Success 11.05.2020 20:00:16 11.05.2020 20:07:51
XXXXX Backup Stopped Warning 11.05.2020 20:00:16 11.05.2020 20:08:59
XXXXX BackupSync Working None 12.05.2020 00:07:22 01.01.1900 00:00:00
XXXXX Backup Stopped Success 07.05.2020 08:20:55 07.05.2020 08:24:06
XXXXX Backup Stopped Warning 11.05.2020 23:00:03 11.05.2020 23:10:49
XXXXX Backup Stopped Failed 11.05.2020 21:51:45 11.05.2020 21:52:34
XXXXX Backup Stopped Success 12.05.2020 03:00:04 12.05.2020 03:03:31
XXXXX Backup Stopped Success 11.05.2020 21:20:02 11.05.2020 21:38:15
XXXXX Backup Stopped Warning 11.05.2020 21:10:18 11.05.2020 22:04:15
XXXXX Backup Stopped Warning 11.05.2020 21:15:23 11.05.2020 21:49:23
XXXXX Backup Stopped Success 11.05.2020 22:22:54 11.05.2020 22:25:58
XXXXX_Mirroring_Backups_to_QNAP_clone1 BackupSync Idle None 11.05.2020 09:01:16 01.01.1900 00:00:00
XXXXX_-_Replication_to_RLZ BackupSync Working None 09.05.2020 20:43:21 01.01.1900 00:00:00
<<<>>>
<<<veeam_client:sep(9)>>>
Status Success
JobName XXXXXX
TotalSizeByte 1481763717120
ReadSizeByte 13978566656
TransferedSizeByte 10064039690
StartTime 11.05.2020 20:00:35
StopTime 11.05.2020 20:07:44
DurationDDHHMMSS 00:00:07:09
AvgSpeedBps 98253585
DisplayName
BackupServer XXXX-XXXXX
<<<<>>>>
Output from Agent.log:
2020-05-12 08:31:14.221 Connected from ‘10.36.47.0’ ipv6 :false -> queue
2020-05-12 08:31:14.221 Put on queue, size is [1]
2020-05-12 08:31:14.222 Found connection on queue, in queue left[0]
2020-05-12 08:31:14.222 Connected from ‘10.36.47.0’ ipv6:false <- queue
2020-05-12 08:31:14.222 [Warn ] OHM file ‘C:\ProgramData\checkmk\agent\bin\OpenHardwareMonitorCLI.exe’ is not found
2020-05-12 08:31:14.223 Allowed Extensions: [exe,bat,vbs,cmd,ps1]
2020-05-12 08:31:14.223 [Trace] Left [39] files to execute
2020-05-12 08:31:14.224 [Trace] Sync Plugin Entry ‘C:\ProgramData\checkmk\agent\plugins\cmk-update-agent.exe’ forced to be async, due to cache_age [3600]
2020-05-12 08:31:14.228 [Trace] Sync Plugin Entry ‘C:\ProgramData\checkmk\agent\plugins\cmk-update-agent.exe’ forced to be async, due to cache_age [3600]
2020-05-12 08:31:14.228 Plugin ‘C:\ProgramData\checkmk\agent\plugins\windows_if.ps1’ is sync with age:0 timeout:60 retry:0
2020-05-12 08:31:14.229 Plugin ‘C:\ProgramData\checkmk\agent\plugins\cmk-update-agent.exe’ is async with age:3600 timeout:60 retry:0
2020-05-12 08:31:14.229 Plugin ‘C:\ProgramData\checkmk\agent\plugins\veeam_backup_status.ps1’ is sync with age:0 timeout:60 retry:0
2020-05-12 08:31:14.230 [Trace] Left [3] files to execute in ‘plugins’
2020-05-12 08:31:14.230 Generating answer number [1]
2020-05-12 08:31:14.230 Id is [605088386708200]
2020-05-12 08:31:14.231 [Trace] Sync Plugin Entry ‘C:\ProgramData\checkmk\agent\plugins\cmk-update-agent.exe’ forced to be async, due to cache_age [3600]
2020-05-12 08:31:14.231 [Trace] Provider ‘wmi_cpuload’ is direct called, id ‘605088386708200’ port [mail:\.\mailslot\Global\WinAgent_0]
2020-05-12 08:31:14.251 Object ‘Win32_PerfRawData_PerfOS_System’ in 19ms sends [777] bytes
2020-05-12 08:31:14.259 Object ‘Win32_ComputerSystem’ in 7ms sends [1330] bytes
2020-05-12 08:31:14.260 [Trace] Sending data ‘wmi_cpuload’ id is [605088386708200] length [2191]
2020-05-12 08:31:14.260 perf: Section ‘wmi_cpuload’ took [28] milliseconds
2020-05-12 08:31:14.260 [Trace] Provider ‘uptime’ is about to be started, id ‘605088386708200’ port [mail:\.\mailslot\Global\WinAgent_0]
2020-05-12 08:31:14.261 Using file ‘C:\Program Files (x86)\checkmk\service\check_mk_agent.exe’ for winperf
2020-05-12 08:31:14.261 [Trace] Sending data ‘uptime’ id is [605088386708200] length [19]
2020-05-12 08:31:14.261 Exec C:\Program Files (x86)\checkmk\service\check_mk_agent.exe for winperf started
2020-05-12 08:31:14.262 [Trace] Provider ‘df’ is about to be started, id ‘605088386708200’ port [mail:\.\mailslot\Global\WinAgent_0]
2020-05-12 08:31:14.262 [Trace] Provider ‘mem’ is about to be started, id ‘605088386708200’ port [mail:\.\mailslot\Global\WinAgent_0]
2020-05-12 08:31:14.262 [Trace] Provider ‘services’ is about to be started, id ‘605088386708200’ port [mail:\.\mailslot\Global\WinAgent_0]
2020-05-12 08:31:14.263 [Trace] Provider ‘ps’ is about to be started, id ‘605088386708200’ port [mail:\.\mailslot\Global\WinAgent_0]
2020-05-12 08:31:14.263 [Trace] Provider ‘fileinfo’ is about to be started, id ‘605088386708200’ port [mail:\.\mailslot\Global\WinAgent_0]
2020-05-12 08:31:14.264 [Trace] Loaded [3] entries in LogWatch
2020-05-12 08:31:14.264 perf: Section ‘uptime’ took [0] milliseconds
2020-05-12 08:31:14.264 async RunStdCmd: “C:\Program Files (x86)\checkmk\service\check_mk_agent.exe” -runonce winperf mail:\.\mailslot\Global\WinAgent_0 id:605088386708200 timeout:10 ip:10.36.47.0 234:phydisk 510:if 238:processor
2020-05-12 08:31:14.265 [Trace] Sending data ‘mem’ id is [605088386708200] length [232]
2020-05-12 08:31:14.265 [Trace] Sending data ‘fileinfo’ id is [605088386708200] length [34]
2020-05-12 08:31:14.265 [Trace] Provider ‘logwatch’ is about to be started, id ‘605088386708200’ port [mail:\.\mailslot\Global\WinAgent_0]
2020-05-12 08:31:14.265 Allowed Extensions: [exe,bat,vbs,cmd,ps1]
2020-05-12 08:31:14.266 perf: Section ‘mem’ took [2] milliseconds
2020-05-12 08:31:14.266 perf: Section ‘fileinfo’ took [1] milliseconds
2020-05-12 08:31:14.267 [Trace] Left [39] files to execute
2020-05-12 08:31:14.267 [Trace] Sync Plugin Entry ‘C:\ProgramData\checkmk\agent\plugins\cmk-update-agent.exe’ forced to be async, due to cache_age [3600]
2020-05-12 08:31:14.270 [Trace] Sync Plugin Entry ‘C:\ProgramData\checkmk\agent\plugins\cmk-update-agent.exe’ forced to be async, due to cache_age [3600]
2020-05-12 08:31:14.271 Plugin ‘C:\ProgramData\checkmk\agent\plugins\windows_if.ps1’ is sync with age:0 timeout:60 retry:0
2020-05-12 08:31:14.271 Plugin ‘C:\ProgramData\checkmk\agent\plugins\cmk-update-agent.exe’ is async with age:3600 timeout:60 retry:0
2020-05-12 08:31:14.271 Plugin ‘C:\ProgramData\checkmk\agent\plugins\veeam_backup_status.ps1’ is sync with age:0 timeout:60 retry:0
2020-05-12 08:31:14.272 [Trace] Left [3] files to execute in ‘plugins’
2020-05-12 08:31:14.272 [Trace] To start [3] sync plugins
2020-05-12 08:31:14.273 Allowed Extensions: [exe,bat,vbs,cmd,ps1]
2020-05-12 08:31:14.273 [Trace] Sending data ‘logwatch’ id is [605088386708200] length [178]
2020-05-12 08:31:14.273 [Trace] Exec app ‘powershell.exe -NoLogo -NoProfile -ExecutionPolicy Bypass -File “C:\ProgramData\checkmk\agent\plugins\windows_if.ps1”’, mode [0]
2020-05-12 08:31:14.274 [Trace] Left [0] files to execute
2020-05-12 08:31:14.274 [Trace] Exec app ‘powershell.exe -NoLogo -NoProfile -ExecutionPolicy Bypass -File “C:\ProgramData\checkmk\agent\plugins\veeam_backup_status.ps1”’, mode [0]
2020-05-12 08:31:14.274 [Trace] df: Processed [4] drives
2020-05-12 08:31:14.275 perf: Section ‘logwatch’ took [7] milliseconds
2020-05-12 08:31:14.275 [Trace] Left [0] files to execute in ‘local’
2020-05-12 08:31:14.275 [Trace] Sending data ‘df’ id is [605088386708200] length [246]
2020-05-12 08:31:14.276 [Trace] To start [0] sync plugins
2020-05-12 08:31:14.276 [Trace] Provider ‘dotnet_clrmemory’ is about to be started, id ‘605088386708200’ port [mail:\.\mailslot\Global\WinAgent_0]
2020-05-12 08:31:14.276 [Trace] Provider ‘msexch’ is about to be started, id ‘605088386708200’ port [mail:\.\mailslot\Global\WinAgent_0]
2020-05-12 08:31:14.277 [Trace] Provider ‘wmi_webservices’ is about to be started, id ‘605088386708200’ port [mail:\.\mailslot\Global\WinAgent_0]
2020-05-12 08:31:14.277 [Trace] Absent/Empty node mrpe.config type is 1
2020-05-12 08:31:14.277 perf: Section ‘df’ took [13] milliseconds
2020-05-12 08:31:14.277 [Trace] Provider ‘local’ is about to be started, id ‘605088386708200’ port [mail:\.\mailslot\Global\WinAgent_0]
2020-05-12 08:31:14.278 [Trace] Provider ‘mrpe’ is about to be started, id ‘605088386708200’ port [mail:\.\mailslot\Global\WinAgent_0]
2020-05-12 08:31:14.278 [Trace] Skipping ‘openhardwaremonitor’ by time
2020-05-12 08:31:14.279 [Trace] Provider ‘skype’ is about to be started, id ‘605088386708200’ port [mail:\.\mailslot\Global\WinAgent_0]
2020-05-12 08:31:14.279 [Trace] Provider ‘spool’ is about to be started, id ‘605088386708200’ port [mail:\.\mailslot\Global\WinAgent_0]
2020-05-12 08:31:14.279 [Warn ] Section ‘local’ cannot provide data
2020-05-12 08:31:14.280 [Trace] Sending data ‘local’ id is [605088386708200] length [0]
2020-05-12 08:31:14.280 [Warn ] Section ‘mrpe’ cannot provide data
2020-05-12 08:31:14.280 [Trace] Sending data ‘mrpe’ id is [605088386708200] length [0]
2020-05-12 08:31:14.281 perf: Section ‘local’ took [2] milliseconds
2020-05-12 08:31:14.281 [Warn ] Section ‘spool’ cannot provide data
2020-05-12 08:31:14.281 [Trace] Return 0X80041010 probably object doesn’t exist
2020-05-12 08:31:14.282 [Trace] Sending data ‘spool’ id is [605088386708200] length [0]
2020-05-12 08:31:14.282 perf: Section ‘mrpe’ took [2] milliseconds
2020-05-12 08:31:14.282 [Warn ] Object ‘Win32_PerfRawData_MSExchangeActiveSync_MSExchangeActiveSync’ in 5ms sends NO DATA
2020-05-12 08:31:14.283 perf: Section ‘spool’ took [2] milliseconds
2020-05-12 08:31:14.283 [Warn ] Sub Section ‘msexch_activesync’ has no data to provide, status = [2]
2020-05-12 08:31:14.286 Received [2319] bytes from ‘wmi_cpuload’
2020-05-12 08:31:14.287 [Trace] Return 0X80041010 probably object doesn’t exist
2020-05-12 08:31:14.288 [Warn ] Object ‘Win32_PerfRawData_MSExchangeAvailabilityService_MSExchangeAvailabilityService’ in 4ms sends NO DATA
2020-05-12 08:31:14.288 [Warn ] Sub Section ‘msexch_availability’ has no data to provide, status = [2]
2020-05-12 08:31:14.292 [Trace] Return 0X80041010 probably object doesn’t exist
2020-05-12 08:31:14.292 [Warn ] Object ‘Win32_PerfRawData_MSExchangeOWA_MSExchangeOWA’ in 4ms sends NO DATA
2020-05-12 08:31:14.293 [Warn ] Sub Section ‘msexch_owa’ has no data to provide, status = [2]
2020-05-12 08:31:14.297 [Trace] Return 0X80041010 probably object doesn’t exist
2020-05-12 08:31:14.297 [Warn ] Object ‘Win32_PerfRawData_MSExchangeAutodiscover_MSExchangeAutodiscover’ in 4ms sends NO DATA
2020-05-12 08:31:14.297 [Warn ] Sub Section ‘msexch_autodiscovery’ has no data to provide, status = [2]
2020-05-12 08:31:14.301 [Trace] Return 0X80041010 probably object doesn’t exist
2020-05-12 08:31:14.302 [Warn ] Object ‘Win32_PerfRawData_MSExchangeISClientType_MSExchangeISClientType’ in 3ms sends NO DATA
2020-05-12 08:31:14.302 [Warn ] Sub Section ‘msexch_isclienttype’ has no data to provide, status = [2]
2020-05-12 08:31:14.306 [Trace] Return 0X80041010 probably object doesn’t exist
2020-05-12 08:31:14.306 [Warn ] Object ‘Win32_PerfRawData_MSExchangeISStore_MSExchangeISStore’ in 3ms sends NO DATA
2020-05-12 08:31:14.307 [Warn ] Sub Section ‘msexch_isstore’ has no data to provide, status = [2]
2020-05-12 08:31:14.311 [Trace] Return 0X80041010 probably object doesn’t exist
2020-05-12 08:31:14.311 [Warn ] Object ‘Win32_PerfRawData_MSExchangeRpcClientAccess_MSExchangeRpcClientAccess’ in 4ms sends NO DATA
2020-05-12 08:31:14.311 [Warn ] Sub Section ‘msexch_rpcclientaccess’ has no data to provide, status = [2]
2020-05-12 08:31:14.312 [Warn ] Section ‘msexch’ cannot provide data
2020-05-12 08:31:14.312 [Trace] Sending data ‘msexch’ id is [605088386708200] length [0]
2020-05-12 08:31:14.312 perf: Section ‘msexch’ took [35] milliseconds
2020-05-12 08:31:14.317 Received [147] bytes from ‘uptime’
2020-05-12 08:31:14.319 [Trace] Sending data ‘ps’ id is [605088386708200] length [21350]
2020-05-12 08:31:14.319 [Trace] Sending data ‘services’ id is [605088386708200] length [13767]
2020-05-12 08:31:14.320 perf: Section ‘ps’ took [56] milliseconds
2020-05-12 08:31:14.320 perf: Section ‘services’ took [56] milliseconds
2020-05-12 08:31:14.348 Received [360] bytes from ‘mem’
2020-05-12 08:31:14.379 Received [162] bytes from ‘fileinfo’
2020-05-12 08:31:14.411 Received [306] bytes from ‘logwatch’
2020-05-12 08:31:14.442 Received [374] bytes from ‘df’
2020-05-12 08:31:14.443 [Warn ] Section ‘skype’ cannot provide data
2020-05-12 08:31:14.443 [Trace] Sending data ‘skype’ id is [605088386708200] length [0]
2020-05-12 08:31:14.444 perf: Section ‘skype’ took [164] milliseconds
2020-05-12 08:31:14.473 Received [128] bytes from ‘local’
2020-05-12 08:31:14.504 Received [128] bytes from ‘mrpe’
2020-05-12 08:31:14.536 Received [128] bytes from ‘spool’
2020-05-12 08:31:14.560 Object ‘Win32_PerfRawData_W3SVC_WebService’ in 282ms sends [2941] bytes
2020-05-12 08:31:14.560 Object ‘Win32_PerfRawData_NETFramework_NETCLRMemory’ in 283ms sends [7468] bytes
2020-05-12 08:31:14.560 [Trace] Sending data ‘wmi_webservices’ id is [605088386708200] length [2990]
2020-05-12 08:31:14.561 [Trace] Sending data ‘dotnet_clrmemory’ id is [605088386708200] length [7605]
2020-05-12 08:31:14.561 perf: Section ‘wmi_webservices’ took [283] milliseconds
2020-05-12 08:31:14.561 perf: Section ‘dotnet_clrmemory’ took [284] milliseconds
2020-05-12 08:31:14.567 Received [128] bytes from ‘msexch’
2020-05-12 08:31:14.598 Received [21478] bytes from ‘ps’
2020-05-12 08:31:14.629 Received [13895] bytes from ‘services’
2020-05-12 08:31:14.661 Received [10999] bytes from ‘winperf’
2020-05-12 08:31:14.692 Received [128] bytes from ‘skype’
2020-05-12 08:31:14.723 Received [3118] bytes from ‘wmi_webservices’
2020-05-12 08:31:14.754 Received [7733] bytes from ‘dotnet_clrmemory’
2020-05-12 08:31:16.645 perf: In [2371] milliseconds process ‘C:\ProgramData\checkmk\agent\plugins\veeam_backup_status.ps1’ pid:[22624] SUCCEDED - generated [0] bytes of data in [0] blocks
2020-05-12 08:31:16.645 [Warn ] Process ‘C:\ProgramData\checkmk\agent\plugins\veeam_backup_status.ps1’ has no data
2020-05-12 08:31:16.895 perf: In [2621] milliseconds process ‘C:\ProgramData\checkmk\agent\plugins\windows_if.ps1’ pid:[11692] SUCCEDED - generated [2156] bytes of data in [7] blocks
2020-05-12 08:31:16.895 [Trace] Provider ‘plugins’ is about to be started, id ‘605088386708200’ port [mail:\.\mailslot\Global\WinAgent_0]
2020-05-12 08:31:16.895 [Trace] Sending data ‘plugins’ id is [605088386708200] length [2353]
2020-05-12 08:31:16.896 perf: Section ‘plugins’ took [0] milliseconds
2020-05-12 08:31:16.910 Received [2481] bytes from ‘plugins’
2020-05-12 08:31:16.910 perf: Answer is ready in [2680] milliseconds
2020-05-12 08:31:16.911 Send [62581] bytes of data
Agoent Output the first lines:
<<<check_mk>>>
Version: 1.6.0p11
BuildDate: Apr 2 2020
AgentOS: windows
Hostname: XXXXXXX
Architecture: 64bit
WorkingDirectory: C:\Windows\system32
ConfigFile: C:\Program Files (x86)\checkmk\service\check_mk.yml
LocalConfigFile: C:\ProgramData\checkmk\agent\check_mk.user.yml
AgentDirectory: C:\Program Files (x86)\checkmk\service
PluginsDirectory: C:\ProgramData\checkmk\agent\plugins
StateDirectory: C:\ProgramData\checkmk\agent\state
ConfigDirectory: C:\ProgramData\checkmk\agent\config
TempDirectory: C:\ProgramData\checkmk\agent\tmp
LogDirectory: C:\ProgramData\checkmk\agent\log
SpoolDirectory: C:\ProgramData\checkmk\agent\spool
LocalDirectory: C:\ProgramData\checkmk\agent\local
Plugins Directory is ok:

I have log into the appliance and send the command:
cmk -nv --debug --cache
Here the Output:
OMD[infra]:~$ cmk -nv --debug --cache RLZP-VEEAM001
Check_MK version 1.6.0p11
- FETCHING DATA
[agent] Using data from cache file /omd/sites/infra/tmp/check_mk/cache/RLZP-VEEAM001
[agent] Use cached data
[mgmt_snmp] Using data from cache file /omd/sites/infra/tmp/check_mk/data_source_cache/mgmt_snmp/RLZP-VEEAM001
[mgmt_snmp] Use cached data
[piggyback] Execute data source
No piggyback files for ‘RLZP-VEEAM001’. Skip processing.
No piggyback files for ‘10.36.46.39’. Skip processing.
CPU utilization OK - Total CPU: 4.13%, user perc: 0.4 %, privileged perc: 0.6 %, 20 CPUs
Disk IO SUMMARY OK - Read: 1.84 kB/s, Write: 198.59 kB/s, Average Read Wait: 0.01 ms, Average Write Wait: 0.03 ms, Average Read Queue Length: 0.00, Average Write Queue Length: 0.01, Read operations: 0.06 1/s, Write operations: 7.69 1/s
Drive Box 2/0 OK - Condition: ok, Temp-Status: ok, (Type: ProLiant-2 Storage System, Model: Apollo 4510Gen10, Serial: , Location: Port 1I Box 1)
Drive Box 2/1 OK - Condition: ok, Temp-Status: ok, (Type: ProLiant-2 Storage System, Model: Apollo 4510Gen10, Serial: , Location: Port 2I Box 1)
Filesystem C:/ OK - 54.31% used (151.41 of 278.76 GB), (warn/crit at 94.77%/98.26%), trend: -118.83 MB / 24 hours
Filesystem R:/ OK - 50.14% used (52.66 of 105.04 TB), trend: +305.55 GB / 24 hours
Filesystem V:/ OK - 86.69% used (66.24 of 76.41 TB), (warn/crit at 99.45%/99.82%), trend: +2.58 TB / 24 hours
HW PSU 0/1 OK - Chassis 0/Bay 1, State: “ok”, Usage: 155 Watts
HW PSU 0/2 OK - Chassis 0/Bay 2, State: “ok”, Usage: 155 Watts
HW PSU 0/3 OK - Chassis 0/Bay 3, State: “ok”, Usage: 155 Watts
HW PSU 0/4 OK - Chassis 0/Bay 4, State: “ok”, Usage: 155 Watts
HW PSU Total OK - Usage: 620 Watts
HW Phydrv 0/0 OK - Bay: 1, Bus number: 0, Status: ok, Smart status: ok, Ref hours: 11080, Size: 286102MB, Condition: ok
HW Phydrv 0/2 OK - Bay: 2, Bus number: 0, Status: ok, Smart status: ok, Ref hours: 11078, Size: 286102MB, Condition: ok
HW Phydrv 2/38 OK - Bay: 1, Bus number: 0, Status: ok, Smart status: ok, Ref hours: 11080, Size: 5723166MB, Condition: ok
HW Phydrv 2/39 OK - Bay: 2, Bus number: 0, Status: ok, Smart status: ok, Ref hours: 11080, Size: 5723166MB, Condition: ok
HW Phydrv 2/40 OK - Bay: 3, Bus number: 0, Status: ok, Smart status: ok, Ref hours: 11080, Size: 5723166MB, Condition: ok
HW Phydrv 2/41 OK - Bay: 4, Bus number: 0, Status: ok, Smart status: ok, Ref hours: 11080, Size: 5723166MB, Condition: ok
HW Phydrv 2/42 OK - Bay: 5, Bus number: 0, Status: ok, Smart status: ok, Ref hours: 11080, Size: 5723166MB, Condition: ok
HW Phydrv 2/43 OK - Bay: 6, Bus number: 0, Status: ok, Smart status: ok, Ref hours: 11080, Size: 5723166MB, Condition: ok
HW Phydrv 2/44 OK - Bay: 7, Bus number: 0, Status: ok, Smart status: ok, Ref hours: 11080, Size: 5723166MB, Condition: ok
HW Phydrv 2/45 OK - Bay: 8, Bus number: 0, Status: ok, Smart status: ok, Ref hours: 11080, Size: 5723166MB, Condition: ok
HW Phydrv 2/46 OK - Bay: 9, Bus number: 0, Status: ok, Smart status: ok, Ref hours: 11080, Size: 5723166MB, Condition: ok
HW Phydrv 2/47 OK - Bay: 10, Bus number: 0, Status: ok, Smart status: ok, Ref hours: 11080, Size: 5723166MB, Condition: ok
HW Phydrv 2/48 OK - Bay: 11, Bus number: 0, Status: ok, Smart status: ok, Ref hours: 11080, Size: 5723166MB, Condition: ok
HW Phydrv 2/49 OK - Bay: 12, Bus number: 0, Status: ok, Smart status: ok, Ref hours: 11080, Size: 5723166MB, Condition: ok
HW Phydrv 2/50 OK - Bay: 13, Bus number: 0, Status: ok, Smart status: ok, Ref hours: 11080, Size: 5723166MB, Condition: ok
HW Phydrv 2/51 OK - Bay: 14, Bus number: 0, Status: ok, Smart status: ok, Ref hours: 11080, Size: 5723166MB, Condition: ok
HW Phydrv 2/52 OK - Bay: 15, Bus number: 0, Status: ok, Smart status: ok, Ref hours: 11080, Size: 5723166MB, Condition: ok
HW Phydrv 2/53 OK - Bay: 16, Bus number: 0, Status: ok, Smart status: ok, Ref hours: 11080, Size: 5723166MB, Condition: ok
HW Phydrv 2/54 OK - Bay: 17, Bus number: 0, Status: ok, Smart status: ok, Ref hours: 11080, Size: 5723166MB, Condition: ok
HW Power Meter OK - Current reading: 156 Watt
Interface 1 OK - [Embedded FlexibleLOM 1 Port 2] (Connected) MAC: 48:DF:37:58:C2:68, 10 Gbit/s, In: 2.39 kB/s (0.0%), Out: 0 B/s (0.0%)
Interface 2 OK - [Embedded FlexibleLOM 1 Port 1] (Connected) MAC: 48:DF:37:58:C2:60, 10 Gbit/s, In: 484.51 B/s (0.0%), Out: 291.05 B/s (0.0%)
Interface 3 OK - [PCIe Slot 1 Port 1] (Connected) MAC: 48:DF:37:63:AE:10, 10 Gbit/s, In: 16.42 kB/s (0.0%), Out: 17.08 kB/s (0.0%)
Interface 4 OK - [PCIe Slot 1 Port 2] (Connected) MAC: 48:DF:37:63:AE:18, 10 Gbit/s, In: 2.18 kB/s (0.0%), Out: 53.02 kB/s (0.0%)
Interface iSCSI - VLAN 166 OK - Teaming Status (up), Members: [1 (Connected), 2 (Connected)] 20 Gbit/s, In: 2.87 kB/s (0.0%), Out: 291.05 B/s (0.0%)
Interface produktiv - VLAN 1 OK - Teaming Status (up), Members: [4 (Connected), 3 (Connected)] 20 Gbit/s, In: 18.6 kB/s (0.0%), Out: 70.1 kB/s (0.0%)
Logical Device OK - Status: OK, Logical volume size: 279.37 GB
Logical Device 1 OK - Status: OK, Logical volume size: 76.41 TB
Management Interface: HW CPU 0 OK - CPU0 “Intel® Xeon® Silver 4114 CPU @ 2.20GHz” in slot 0 is in state “ok”
Management Interface: HW CPU 1 OK - CPU1 “Intel® Xeon® Silver 4114 CPU @ 2.20GHz” in slot 0 is in state “ok”
Management Interface: HW Controller 0 OK - Condition: ok, Board-Condition: ok, Board-Status: ok, (Role: other, Model: 92, Slot: 0, Serial: PEYHB0CRHAX10Q )
Management Interface: HW Controller 2 OK - Condition: ok, Board-Condition: ok, Board-Status: ok, (Role: other, Model: 97, Slot: 2, Serial: PFJHD0ARCB01WT )
Management Interface: HW FAN1 system OK - FAN Sensor 1 “system”, Speed is normal, State is ok
Management Interface: HW FAN10 system OK - FAN Sensor 10 “system”, Speed is normal, State is ok
Management Interface: HW FAN2 system OK - FAN Sensor 2 “system”, Speed is normal, State is ok
Management Interface: HW FAN3 system OK - FAN Sensor 3 “system”, Speed is normal, State is ok
Management Interface: HW FAN4 system OK - FAN Sensor 4 “system”, Speed is normal, State is ok
Management Interface: HW FAN5 system OK - FAN Sensor 5 “system”, Speed is normal, State is ok
Management Interface: HW FAN6 system OK - FAN Sensor 6 “system”, Speed is normal, State is ok
Management Interface: HW FAN7 system OK - FAN Sensor 7 “system”, Speed is normal, State is ok
Management Interface: HW FAN8 system OK - FAN Sensor 8 “system”, Speed is normal, State is ok
Management Interface: HW FAN9 system OK - FAN Sensor 9 “system”, Speed is normal, State is ok
Management Interface: HW Mem 10 OK - Board: 0, Num: 10, Type: n/a, Size: 32768 MB, Status: good , Condition: ok
Management Interface: HW Mem 2 OK - Board: 0, Num: 2, Type: n/a, Size: 32768 MB, Status: good , Condition: ok
Management Interface: SNMP Info OK - Integrated Lights-Out 5 2.10 Oct 30 2019, ILOCZ3845HTJ5.itk.local, unknown
Management Interface: Temperature 1 ambient OK - 18.0 °C
Management Interface: Temperature 10 memory OK - 33.0 °C
Management Interface: Temperature 12 system OK - 35.0 °C
Management Interface: Temperature 14 system OK - 35.0 °C
Management Interface: Temperature 16 system OK - 41.0 °C
Management Interface: Temperature 17 system OK - 50.0 °C
Management Interface: Temperature 18 system OK - 34.0 °C
Management Interface: Temperature 19 system OK - 37.0 °C
Management Interface: Temperature 2 cpu OK - 40.0 °C
Management Interface: Temperature 20 system OK - 45.0 °C
Management Interface: Temperature 21 system OK - 41.0 °C
Management Interface: Temperature 22 system OK - 31.0 °C
Management Interface: Temperature 23 system OK - 54.0 °C
Management Interface: Temperature 24 system OK - 30.0 °C
Management Interface: Temperature 25 system OK - 40.0 °C
Management Interface: Temperature 26 system OK - 40.0 °C
Management Interface: Temperature 27 ioBoard OK - 62.0 °C
Management Interface: Temperature 28 ioBoard OK - 61.0 °C
Management Interface: Temperature 29 ioBoard OK - 47.0 °C
Management Interface: Temperature 3 cpu OK - 40.0 °C
Management Interface: Temperature 30 ioBoard OK - 40.0 °C
Management Interface: Temperature 31 system OK - 25.0 °C
Management Interface: Temperature 33 system OK - 21.0 °C
Management Interface: Temperature 34 system OK - 35.0 °C
Management Interface: Temperature 35 system OK - 29.0 °C
Management Interface: Temperature 4 memory OK - 32.0 °C
Management Interface: Uptime OK - Up since Wed Jan 29 10:17:43 2020 (103d 21:40:48)
Memory and pagefile OK - Memory usage: 45.42% (28.92 GB/63.66 GB), Commit charge: 23.87% (17.46 GB/73.16 GB)
Service MSSQLVEEAMSQL2016 OK - SQL Server (VEEAMSQL2016): running (start type is auto)
Service VeeamBackupSvc OK - Veeam Backup Service: running (start type is auto)
Service VeeamEnterpriseManagerSvc OK - Veeam Backup Enterprise Manager: running (start type is auto)
Service VeeamTapeSvc OK - Veeam Tape Access Service: running (start type is auto)
Service VeeamTransportSvc OK - Veeam Data Mover Service: running (start type is auto)
Service VeeamWANSvc OK - Veeam WAN Accelerator Service: running (start type is auto)
System Time OK - Offset is 0 sec (warn/crit at 30/60 sec)
Uptime OK - Up since Tue May 5 08:27:01 2020 (7d 00:31:30)
Web Service VeeamBackup OK - 0.00 connections
OK - [agent] Version: 1.6.0p11, OS: windows, [mgmt_snmp] Success, execution time 0.5 sec | execution_time=0.471 user_time=0.480 system_time=0.000 children_user_time=0.000 children_system_time=0.000 cmk_time_snmp=-0.007 cmk_time_agent=0.004
 You said that so easily…