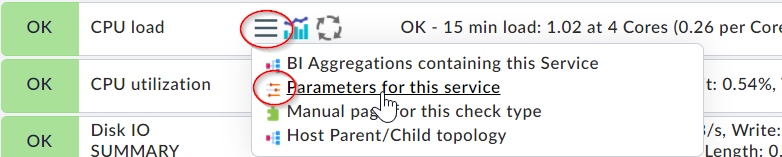
I m using 1.6 check_mk , i observe that , my machine cpu was crossing 200 % and load average was also 10:9:9 , still check_mk not shown any critical message, it was showing as OK only , can you please tell me where can we set the configuration for all results for critical , warning and OK ?
i m setting below value with local plugin for some daemon process.
P myservice3 count1=28;30;40|count2=25;23;27|count3=66;65;70 OK - This is my custom output"
my small question regarding graph which gets display .
i want to display count1 as count , count2 as Percentage (%) and count3 as MB memory on y axis , how i can achieve the same ?
This topic was automatically closed 365 days after the last reply. New replies are no longer allowed. Contact @fayepal if you think this should be re-opened.