CMK version: 2.4.0p29.cee PRO/enterprise
OS version: RHEL 8
Hi
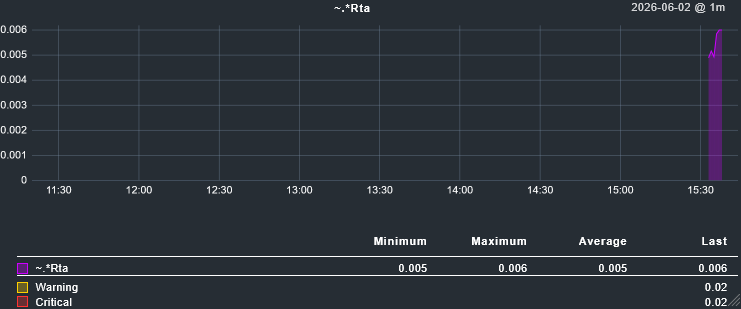
After updating to 2.4.0p29 I noticed the perf-o-meters of Nagios check_ping based services have disappeared and their metric names showed in the performance graph have turned into ~.*Rta. Here you can watch

Compare the same from 2.3.0p42 release:


update 1: perhaps the problem is the new scripts added into the 2.4 version
# locate metrics.py | grep /gui/

/opt/omd/versions/2.3.0p47.cee/lib/python3/cmk/gui/metrics.py

/opt/omd/versions/2.4.0p29.cee/lib/python3/cmk/gui/metrics.py
/opt/omd/versions/2.4.0p29.cee/lib/python3/cmk/gui/graphing/_metrics.py
/opt/omd/versions/2.4.0p29.cee/lib/python3/cmk/gui/graphing/_translated_metrics.py
update 2: the lib/python3/cmk/gui/graphing/_rrd_fetch.py contains these lines
            >= current_version
            # Note: Reverse translations only work for 1-to-1-mappings, entries such as
            # "~.*rta": {"name": "rta", "scale": m},
            # cannot be reverse-translated, since multiple metric names are apparently mapped to a
            # single new name. This is a design flaw we currently have to live with.
            and not metric_name.startswith("~")
How long do we have “to live with this design flaw”?
Best regards
P.D: Check_MK never dissapoints – solving bugs and issues and creating new ones.