(To graph this, I scanned the access_log files in ~/var/log/apache/ for POST /mysite/check_mk/ajax_activation_state.py entries and calculated the time difference between the first and last entry for each activation_id string – if there is a better way, please let me know)
Before the update (marked by the blue dashed line), the mean activation time was 27.8s, now it is 47.5s.
I’ve searched the forum for this but couldn’t find anything useful apart from “run cmk -U and check for errors”. Unfortunately, there are none.
Running cmk -Uvv gives me these lines after 3 seconds:
Trying to acquire lock on /omd/sites/mysite/etc/check_mk/main.mk
Got lock on /omd/sites/mysite/etc/check_mk/main.mk
Generating configuration for core (type nagios)...
Trying to acquire lock on /omd/sites/mysite/var/check_mk/passwords_merged
Got lock on /omd/sites/mysite/var/check_mk/passwords_merged
Releasing lock on /omd/sites/mysite/var/check_mk/passwords_merged
Released lock on /omd/sites/mysite/var/check_mk/passwords_merged
Trying to acquire lock on /omd/sites/mysite/var/check_mk/core/helper_config/serial.mk
Got lock on /omd/sites/mysite/var/check_mk/core/helper_config/serial.mk
Releasing lock on /omd/sites/mysite/var/check_mk/core/helper_config/serial.mk
Released lock on /omd/sites/mysite/var/check_mk/core/helper_config/serial.mk
Trying to acquire lock on /omd/sites/mysite/var/check_mk/licensing/licensed_state
Got lock on /omd/sites/mysite/var/check_mk/licensing/licensed_state
Releasing lock on /omd/sites/mysite/var/check_mk/licensing/licensed_state
Released lock on /omd/sites/mysite/var/check_mk/licensing/licensed_state
Then it takes another 34 seconds during which nothing is printed, then a bunch of output follows (taking 6 seconds until the command is finished).
Is there anything I could do to further debug this and figure out what happens during these 34 seconds?
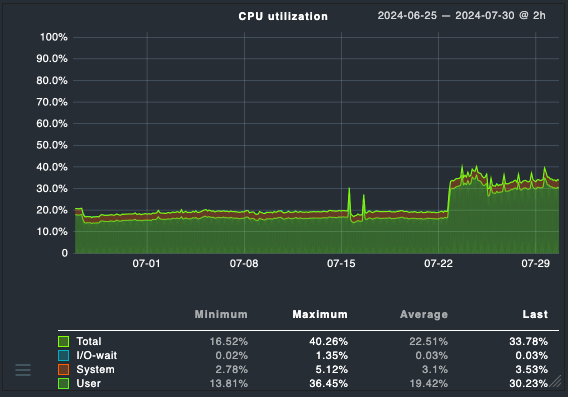
Is this normal? I’ve read about increased CPU usage (yes, I can see that, see below), but not that the activation time doubles. Besides, I did not observe this issue with my own private CRE instance…
Here i would use first the cmk --debug -vvU this is only the time to generate the new configuration.
This is not the time needed also for the restart/reload of the core.
To time the complete activation a cmk --debug -vvR is a better approach.
To see all possible errors or problems, it is good to include the --debug.
Thank you. I did that, but before, I ran while true; do date; sleep 1; done & so I get some time stamps. Here’s the output, no errors or warnings were shown so I removed lots of host config/lock related lines:
OMD[mysite]:~$ cmk --vvR --debug
Tue Jul 30 17:20:52 CEST 2024
Tue Jul 30 17:20:53 CEST 2024
Trying to acquire lock on /omd/sites/mysite/etc/check_mk/main.mk
Got lock on /omd/sites/mysite/etc/check_mk/main.mk
Generating configuration for core (type nagios)...
Trying to acquire lock on /omd/sites/mysite/var/check_mk/passwords_merged
Got lock on /omd/sites/mysite/var/check_mk/passwords_merged
Releasing lock on /omd/sites/mysite/var/check_mk/passwords_merged
Released lock on /omd/sites/mysite/var/check_mk/passwords_merged
Trying to acquire lock on /omd/sites/mysite/var/check_mk/core/helper_config/serial.mk
Got lock on /omd/sites/mysite/var/check_mk/core/helper_config/serial.mk
Releasing lock on /omd/sites/mysite/var/check_mk/core/helper_config/serial.mk
Released lock on /omd/sites/mysite/var/check_mk/core/helper_config/serial.mk
Trying to acquire lock on /omd/sites/mysite/var/check_mk/licensing/licensed_state
Got lock on /omd/sites/mysite/var/check_mk/licensing/licensed_state
Releasing lock on /omd/sites/mysite/var/check_mk/licensing/licensed_state
Released lock on /omd/sites/mysite/var/check_mk/licensing/licensed_state
Tue Jul 30 17:20:54 CEST 2024
Tue Jul 30 17:20:55 CEST 2024
Tue Jul 30 17:20:56 CEST 2024
Tue Jul 30 17:20:57 CEST 2024
Tue Jul 30 17:20:58 CEST 2024
Tue Jul 30 17:20:59 CEST 2024
Tue Jul 30 17:21:00 CEST 2024
Tue Jul 30 17:21:01 CEST 2024
Tue Jul 30 17:21:02 CEST 2024
Tue Jul 30 17:21:03 CEST 2024
Tue Jul 30 17:21:04 CEST 2024
Tue Jul 30 17:21:05 CEST 2024
Tue Jul 30 17:21:06 CEST 2024
Tue Jul 30 17:21:07 CEST 2024
Tue Jul 30 17:21:08 CEST 2024
Tue Jul 30 17:21:09 CEST 2024
Tue Jul 30 17:21:10 CEST 2024
Tue Jul 30 17:21:11 CEST 2024
Tue Jul 30 17:21:12 CEST 2024
Tue Jul 30 17:21:13 CEST 2024
Tue Jul 30 17:21:14 CEST 2024
Tue Jul 30 17:21:15 CEST 2024
Tue Jul 30 17:21:16 CEST 2024
Tue Jul 30 17:21:17 CEST 2024
Tue Jul 30 17:21:18 CEST 2024
Tue Jul 30 17:21:19 CEST 2024
Tue Jul 30 17:21:20 CEST 2024
Tue Jul 30 17:21:21 CEST 2024
Tue Jul 30 17:21:22 CEST 2024
Tue Jul 30 17:21:23 CEST 2024
Tue Jul 30 17:21:24 CEST 2024
Tue Jul 30 17:21:25 CEST 2024
Tue Jul 30 17:21:26 CEST 2024
Tue Jul 30 17:21:27 CEST 2024
Tue Jul 30 17:21:28 CEST 2024
Tue Jul 30 17:21:29 CEST 2024
Tue Jul 30 17:21:30 CEST 2024
Tue Jul 30 17:21:31 CEST 2024
(... acquiring and releasing many locks ...)
Precompiling host checks...Creating precompiled host check config...
Precompiling host checks...
(... several host related lines ...)
OK
Running '/omd/sites/mysite/bin/nagios -vp /omd/sites/mysite/tmp/nagios/nagios.cfg'
Validating Nagios configuration...
Tue Jul 30 17:21:34 CEST 2024
OK
Trying to acquire lock on /omd/sites/mysite/var/check_mk/core/helper_config/5443/stored_passwords
Got lock on /omd/sites/mysite/var/check_mk/core/helper_config/5443/stored_passwords
Releasing lock on /omd/sites/mysite/var/check_mk/core/helper_config/5443/stored_passwords
Released lock on /omd/sites/mysite/var/check_mk/core/helper_config/5443/stored_passwords
Restarting monitoring core...
Tue Jul 30 17:21:35 CEST 2024
Tue Jul 30 17:21:36 CEST 2024
Tue Jul 30 17:21:37 CEST 2024
Tue Jul 30 17:21:38 CEST 2024
OK
Releasing lock on /omd/sites/mysite/etc/check_mk/main.mk
Released lock on /omd/sites/mysite/etc/check_mk/main.mk
Tue Jul 30 17:21:39 CEST 2024
Tue Jul 30 17:21:40 CEST 2024
Tue Jul 30 17:21:41 CEST 2024
OMD[mysite]:~$
Still, the duration that I mentioned in the first post where no debug prints are shown (37 seconds) is longer than the whole activation process used to take with v2.2 (about 28s), which is why I’m interested in what exactly happens there.
I grepped for some strings that it outputs and found out that the config generation happens in lib/check_mk/base/core_nagios.py. I’ve added a bunch of debug prints and found out that it is this section that takes so long:
This loop did about 25 hosts per second, but two hosts took much longer (one 9s, the other 7s). I added much more debugging down the line and found that it calls get_service_attributes() for each service, and on these two servers, that takes long, in particular
which calls this block for the CheckMK service here:
The two servers that are taking so long are backup servers with lots of zfs snapshots, so zfsget reports a lot of filesystems (but I have disabled most of them). I’ll try to dig deeper and will report my findings.
I found something that might be related to the issue.
the backup servers use ZFS snapshots named by the timestamp of the backup
backups (snapshots) get deleted when they get too old
automatic service discovery is enabled, along with automatically adding newly discovered services
there is a “disabled services” rule that disables all zfsget-related services that match the snapshot naming scheme, to avoid having hundreds of unnecessary “filesystem” services on the backup servers
So initially, the discovery adds, say, 1000 snapshots on the backup server as new services, which all get disabled by the rule. What I did not anticipate when I set this up was that over time, all of these snapshots are deleted on the backup server as they reach their expiry age, but at the same time, new snapshots are constantly made and are being auto-discovered (and auto-added as disabled).
Which ultimately led to…
I’ve patched the agents on the two servers to not report snapshots anymore and am now trying to remove 32k unknown services by moving them to undecided. This turned out to be quite a challenge. The service discovery page alone often throws the 110 second timeout before I can even do anything…
Either way, these services didn’t all spawn yesterday, so still, something must have changed with the 2.3 update.
OK so one server had 32k disabled services, the other had 46k (so many in fact that the “service discovery” page would run into a timeout).
Fun sidenote: My Chrome managed to display the discovery page for the server with 32k services, but the tab consumed 3.2G RAM. When i tried to move some of them to undecided, it tried to rescan/refresh as it usually does, and the tab’s memory usage went up to 5GB, then the tab crashed with “out of memory”.
I was able to get rid of the ZFS services by running cmk --checks zfsget -II <hostname>.
I made a few changes and activated them and it looks like I’m back to 23-26 seconds per activation. So maybe that was it!
During this journey, I also found out that a bulk discovery from the web interface does not remove vanished services that are disabled. I had to use the CLI.
This is quite common in a distributed scenario and/or when having large .mk files to parse…
We from time to time increase the timeout to 390 or more by running an Ansible role.
Its frustrating that the solution to decrease the load on the system is to use the GUI, that’s not working due to the increased load
Found it, guess my google foo was too bad last time.
For the record, if you get this message in the GUI:
Checkmk exception: Your request timed out after 110 seconds. This issue may be related to a local configuration problem or a request which works with a too large number of objects. But if you think this issue is a bug, please send a crash report.
…and you want to raise the timeout, it’s in /opt/omd/versions/default/lib/python3/cmk/gui/http.py in def request_timeout. There might be additional timeout values in Apache configs that would also need raising.