Add custom check to monitoring + add download icon

Hi,
so as the topic says i got a custom check which i want to add to my monitoring. I bet its done with a few clicks, but i really cant find a way how to achieve this.

Right now it looks like this:

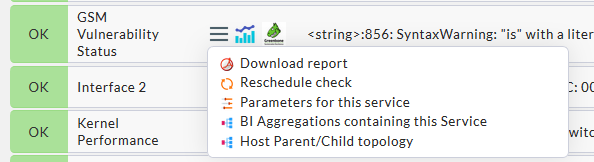
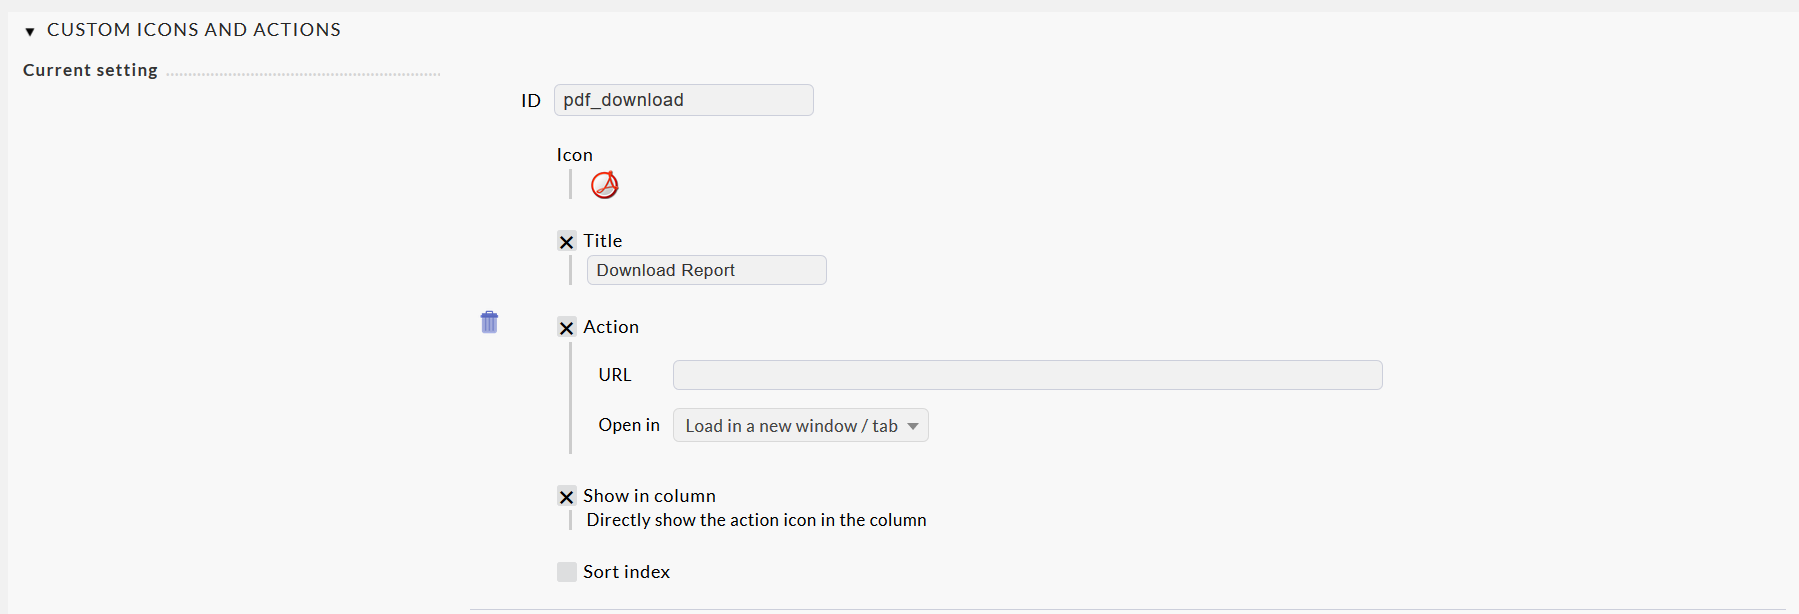
My second question is about adding an icon. With a specific command i can receive pdf reports from greenbone which i want to put in a download-icon or something similar.
Is this possible?

best regards

Hi,
some hints for an icon (e.g. download):

  1. You have to setup actions for the download URL: Setup > GENERAL: Global settings > Custom icons and actions.
  2. You have to assign these actions to your hosts: Setup > HOSTS: Monitoring rules > Custom icons or actions for hosts in status GUI.

Let me know if you need further assistance.

Karl

2 Likes

You error message looks like a script error that something went wrong with a comparison.
For further debug the check script would be good to see.

Hi,
thank your for your answers. This is what i see:


I am not sure how to handle this, i thougt there will be fields to put some code or sth similar.

About the error message, hm i dont really know if i can debug this. It gives me the right output tho

Hi,
at work I also have a new project which involves greenbone/openvas.

The official scripts are to be found here:

Also, there seem to be some people who already implemented/used some sort of check:

I didn’t have the time to try either of them, since I am stuck with mobile device management for mac os x first, later we will scan those macintoshs with greenbone (shoot me pls :face_with_symbols_over_mouth:).

Actions are http or https-URLs.

Karl

ah okay got it. thank you

before i get into it, i want to add my custom check into the monitoring.
I see the custom check in the services of the specific host (like in my first picture above) but not in the monitoring. Where i can simply add the custom check?

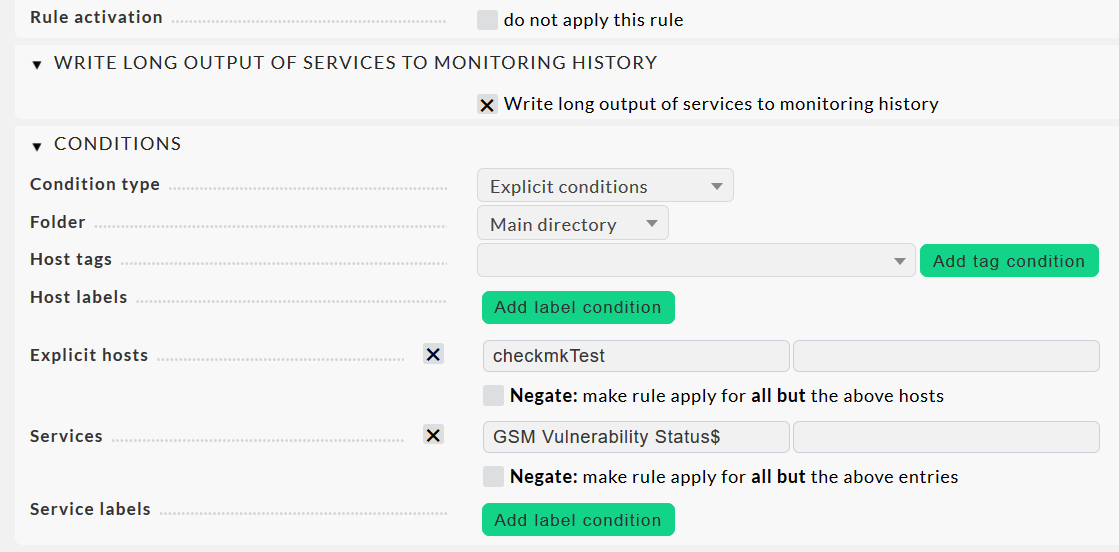
You can find it under Host & Service Parameters -> Active Checks -> Classical active and passive Monitoring checks

Then just add a rule with the path to the gvm script followed by the parameters.
And under conditions enter the host where you want the service to be applied to (can also be any another condition and you can replace the hostname with the variable $HOSTNAME$ in the commandline arguments).

thank you, it works now. well, it came with a little differences.
In Setup->Hosts-> Services of hosts, the custom checks shows with the long output:

But in Monitor->Hosts-> Services of Host, the custom check shows the short output and is flapping:

My rule for write long output of services to monitoring history, looks like this:

Why is the long output not applying?

I dunno. Where did you find this rule? Could it be that it is only available in CEE? Or that it comes in a newer version of CMK?

You could try to suppress these warnings if they go to stderr by appending 2>&1 to your cmdline

ah yes, forgot to mention that i am running 1.7
I will try add 2>&1 to my CL.

In my custom rule, i can go to service parameters, there i found this rule to show the long output. Unfortunately it does not seem to work

Yes, but use it only as last resort.

You should preferrably check the code and try to find out what is causing the error message to appear in the first place. The result of the check may be wrong to due this error appearing.

Alright. I got the script from greenbone, in Setup->Hosts-> Services of hosts it is displayed correctly. I don’t understand why the status in monitoring is not fully displayed

Hi,
i did setup a new action for a download URL, looks like this:

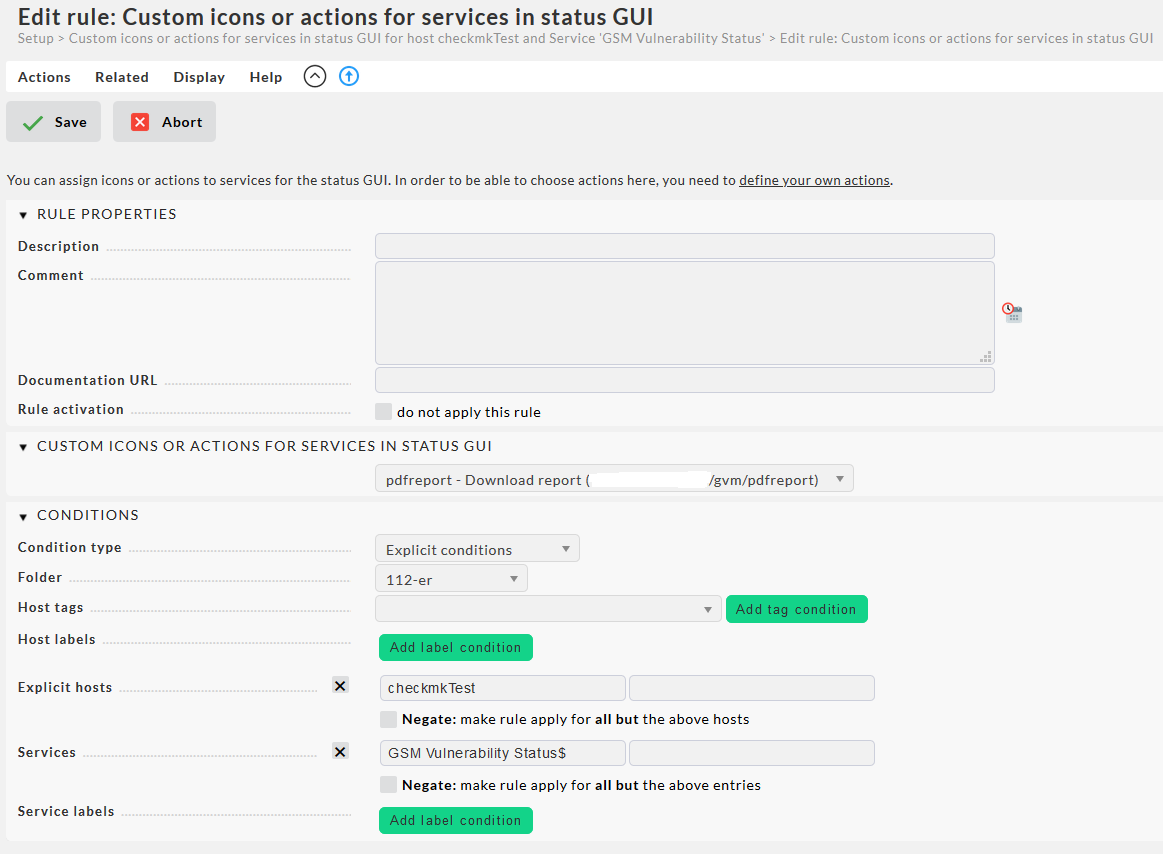
But i could not follow step 2 since i did not find the correct service customs icons..
I found it in my monitoring in my custom rule. There i could add a rule called Custom icons or actions..

So my PDF-Icon shows up in my services:
grafik

Since i got a script for crrating reports, i want to add it to that icon. Is this possible?

1 Like

This topic was automatically closed 365 days after the last reply. New replies are no longer allowed.