CMK version:
2.1.0p27 OS version:
Centos 7 Error message:
Not able to add Grafana Output of “cmk --debug -vvn hostname”: (If it is a problem with checks or plugins)
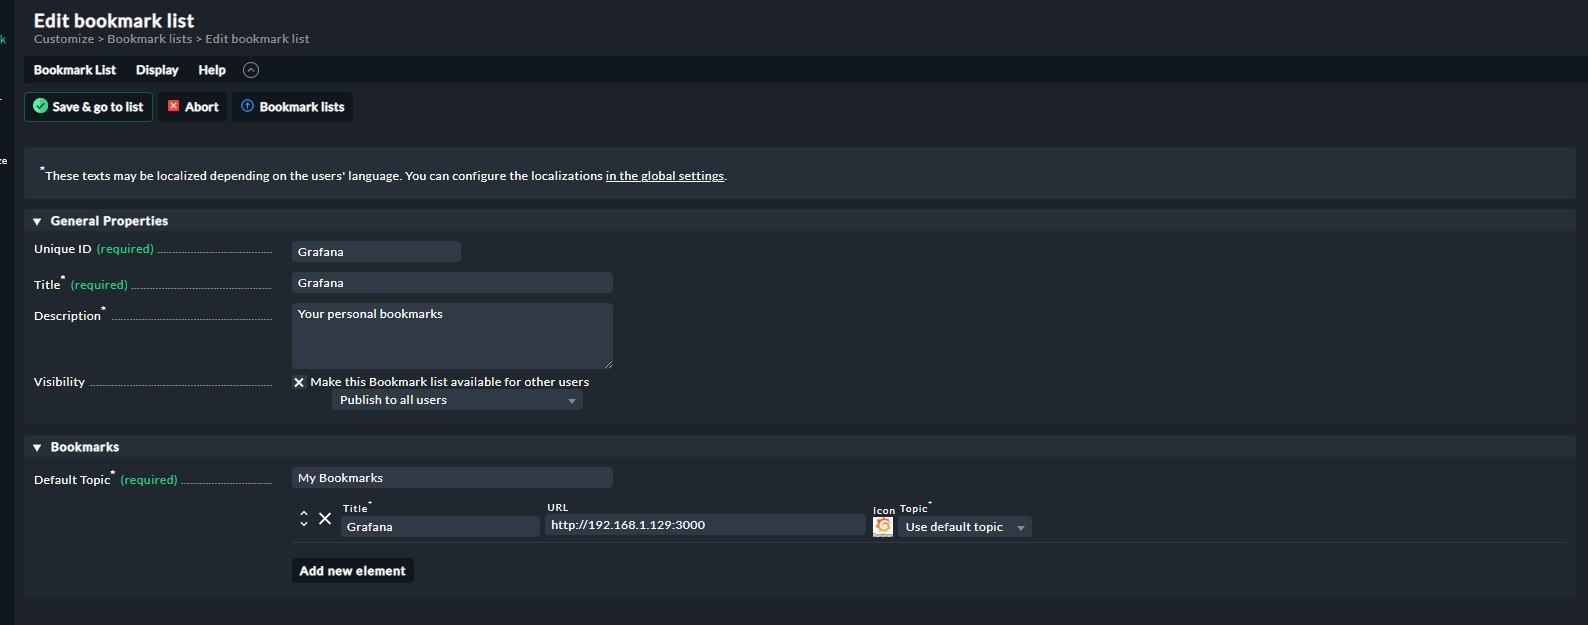
I wanted to open grafana directly from Checkmk so I have added it to bookmarks and configured it, in grafana I have enabled it to accept connections from outside but Checkmk gives me an error when it establishes the connection telling me that there is a reverse proxy when it does not exist. I don’t know if there is something else I’m missing in the Grafana configuration or if Checkmk is really doing a reverse proxy configuration. can you give me more information?
Checkmk uses IFRAMEs and that is a big no-no to refer to external sites. You should not do it. I cant find any reason why you want to do it either. its stupid
Hello, I think it is very interesting because I do that the user does not leave the checkmk application to see the monitoring system of your department, note that Checkmk although it is a monitoring platform there are also parts that see each of the aeras, one of systems, other database, other networking, other security and so a long etc., if created in this way each user only sees the graphs of your area without leaving Checkmk. Best regards
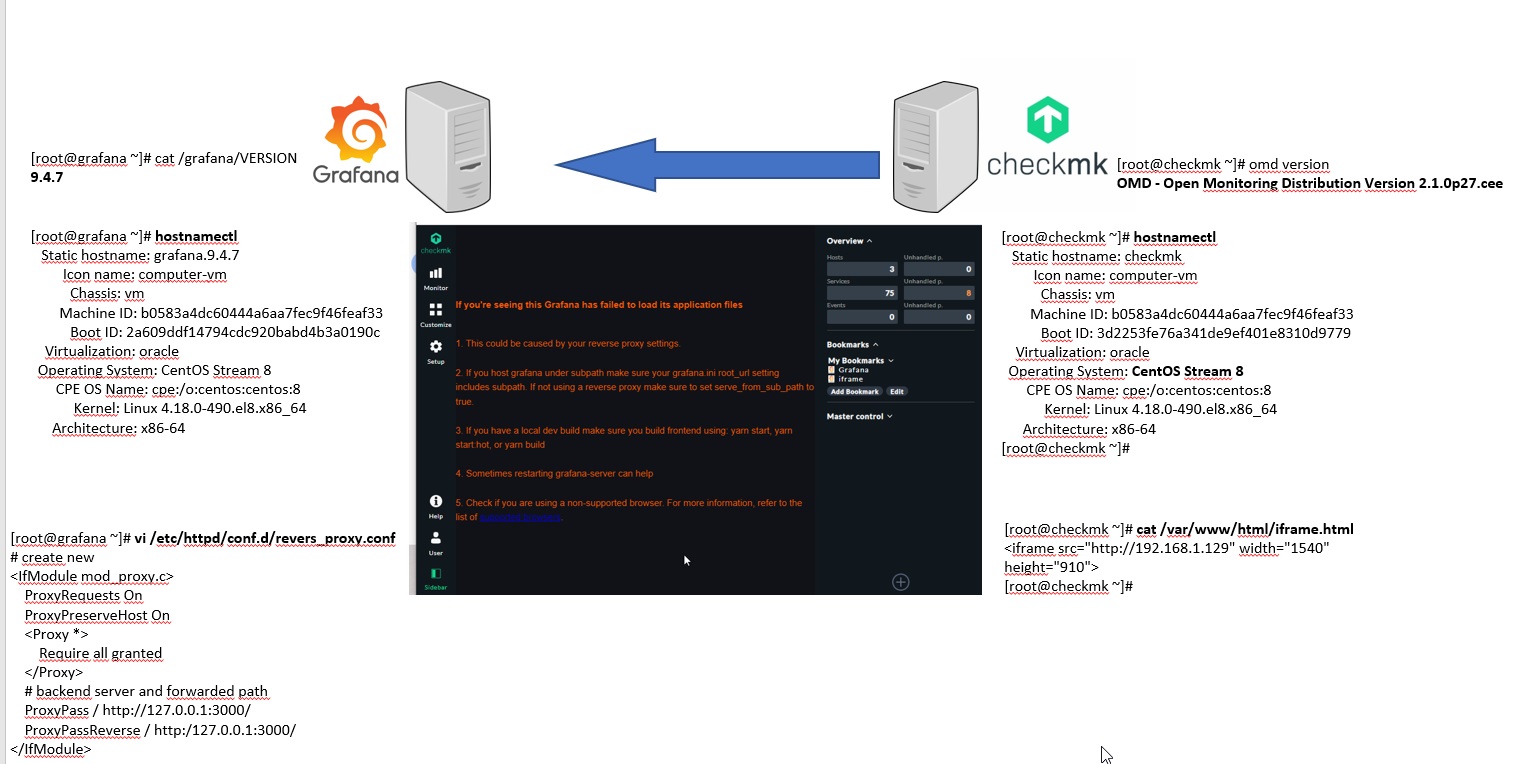
Hello I don’t have any reverse proxy configured, the configuration is directly against another vm that only has Grafana installed. For this reason I find it strange that at no point in the documentation that you provide the configuration of access to Grafana from an external proxy.
Can you provide me with this information? Best regards and thank you very much
#new import
import urllib.request, urllib.parse, urllib.error

def paint_pilot_link(what, row, tags, host_custom_vars ):
# Available Custom Attributes:
# APP
# OS
# ENV
# DC
# HOST URL:
# FILE

# SERVIEC URL
   OS=host_custom_vars.get('OS', '')
   APP=host_custom_vars.get('APP', '')
   ENV=host_custom_vars.get('ENV','')
   SUBAPP=host_custom_vars.get('GROUP','')
   DC=host_custom_vars.get('DC','')
   FILENAME=host_custom_vars.get('FILENAME','')
   BASE=FILENAME.split('/')[2]
   HOST=row["host_name"]
   SITE=row["site"]
   if SITE.lower() == "preprod":
       PILOT_BASE_URL="<some URL>"
   else:
       PILOT_BASE_URL="<some URL>"
   if what == "host":
      PILOT_VAR_URL="&type=host&dc=%s&os=%s&env=%s&app=%s&host=%s&base=%s" %(DC,OS,ENV,APP,HOST,BASE)
   else:
      CHECK=row["service_check_command"]
      if "check_mk_active" in CHECK or "check-mk-custom" in CHECK:
          CHECK=CHECK.split('!')[0]
      #SERVICE=row["service_description"]
      #encoding the service name
      SERVICE_RAW=row["service_description"]
      SERVICE=urllib.parse.urlencode({"service":SERVICE_RAW})
      #changing the below to a similar one

      PILOT_VAR_URL="&type=service&dc=%s&os=%s&env=%s&app=%s&plugin=%s&%s&host=%s&base=%s" %(DC,OS,ENV,APP,CHECK,SERVICE,HOST,BASE)

   # Use the khelpcenter icon, you can use custom icons or the icons from ~/share/check_mk/web/htdocs/images/icons/
   #PILOT_VAR_URL= PILOT_VAR_URL.replace(" ", "_")
   return 'khelpcenter', _('Open pilot instructions'), ('%s%s' % (PILOT_BASE_URL, PILOT_VAR_URL) , '_blank')
multisite_icons_and_actions['pilot_object_link'] = {
    'paint':    paint_pilot_link,
    'toplevel': True,
}
Hello, I have seen your code, but I have a problem I have it in centos 8 and I have looked for the directory that indicates me, but I have three empty directories, I think I can’t find the directory that makes reference, could you indicate it to me?
[root@checkmk share]# locate check_mk | grep plugin | grep icons
/opt/omd/sites/lab/.version_meta/skel/local/share/check_mk/web/plugins/icons
/opt/omd/sites/lab/local/share/check_mk/web/plugins/icons
/opt/omd/versions/2.1.0p27.cee/skel/local/share/check_mk/web/plugins/icons
[root@checkmk share]# cd /opt/omd/sites/lab/local/share/check_mk/web/plugins/icons
[root@checkmk icons]# ls -lrt
total 0
[root@checkmk icons]# cd /opt/omd/versions/2.1.0p27.cee/skel/local/share/check_mk/web/plugins/icons
[root@checkmk icons]# ls -lrt
total 0
[root@checkmk icons]# cd /opt/omd/sites/lab/.version_meta/skel/local/share/check_mk/web/plugins/icons
[root@checkmk icons]# ls -lrt
total 0
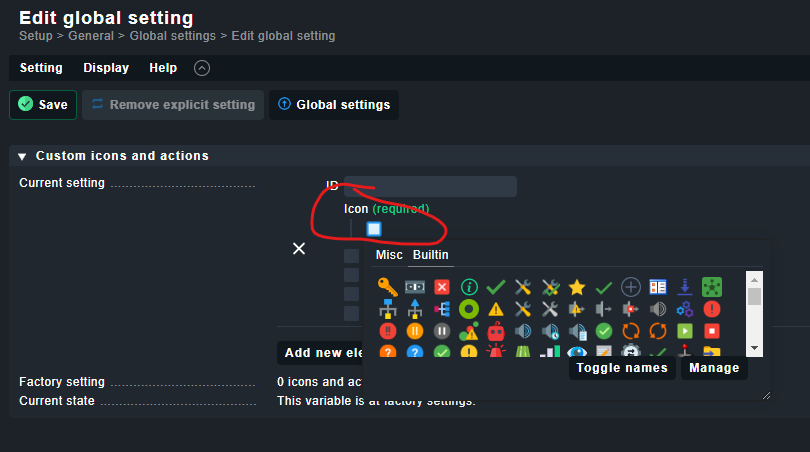
But you can also go to Custom icons and actions in global settings and add a new entry. You find the icons there and while you hoover over the icon you see the icon name.
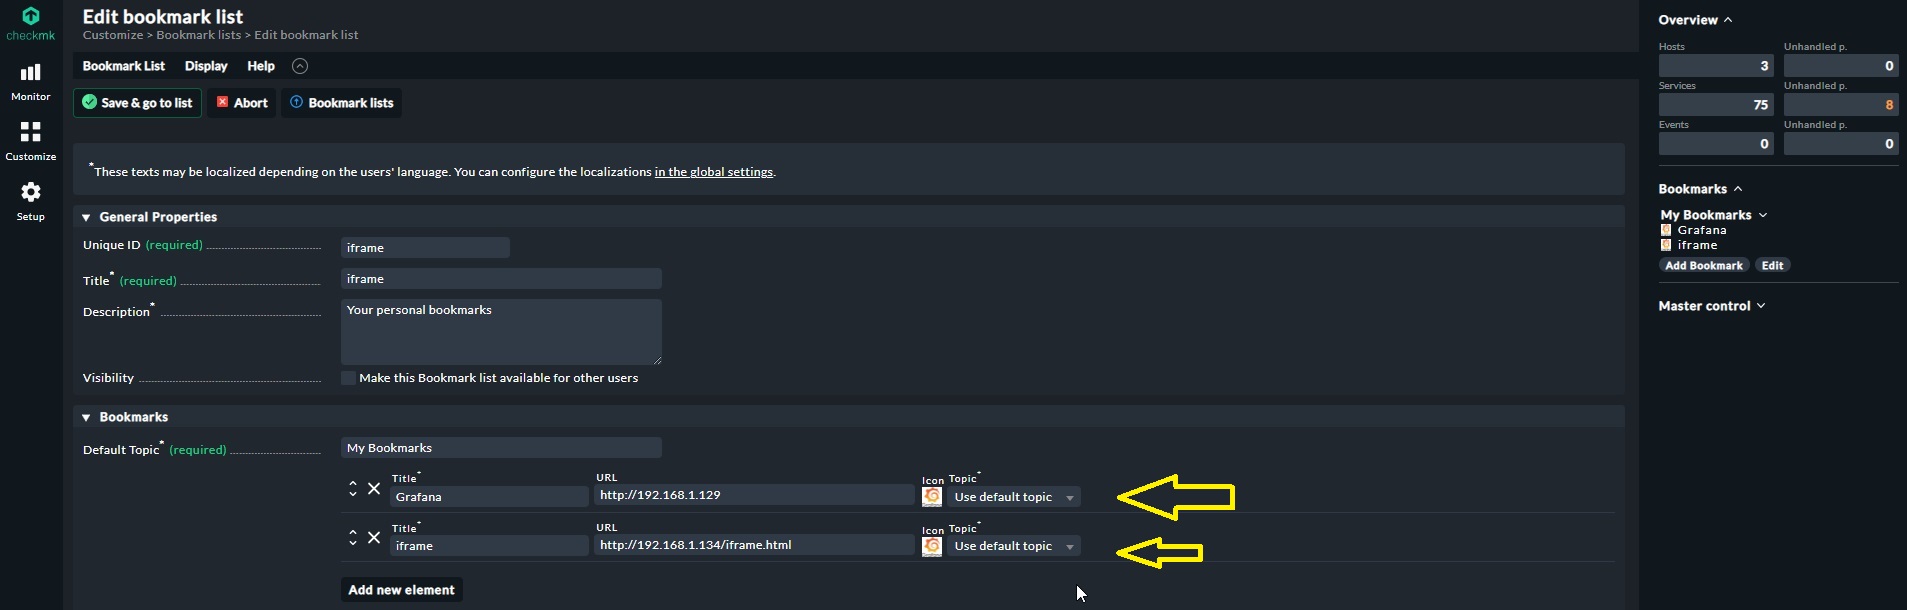
Hello, the icons have not been the problem, I have already put them but to put an iframe and make it open it does not let me.
I have added a line of code in the file and I have created a reverse proxy with apache on the Grafana server so that it can accept it but still does not allow me there is some parameter that I need to do so can you provide me that parameter would be ?
This topic was automatically closed 365 days after the last reply. New replies are no longer allowed. Contact an admin if you think this should be re-opened.