Hi,
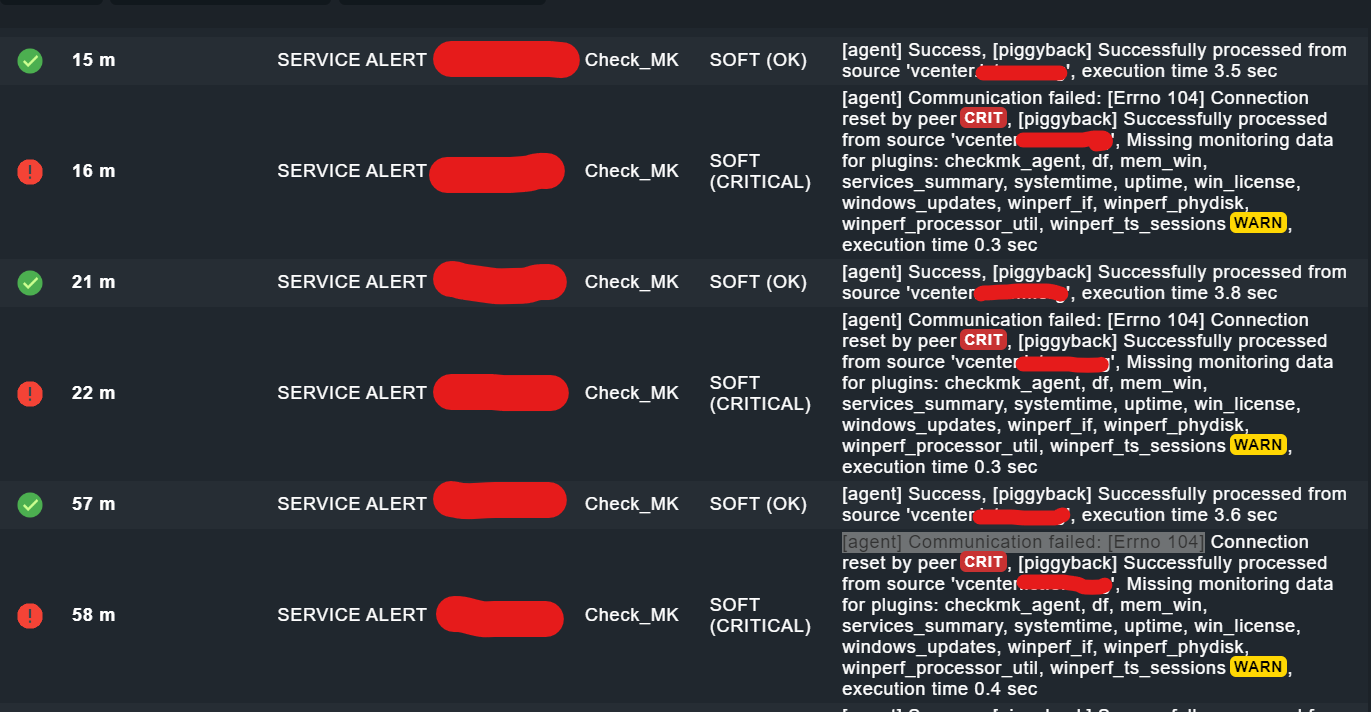
I have a weird problem with 3 nodes (Ubuntu 20.04 - CMK RAW) where communication with the agent keeps giving errors "[agent] Communication failed: [Errno 104] Connection reset by peer - Got no information from host - execution time 0.1 sec. - it goes from CRIT → OK after a while or sometimes message comes with with service flapping.
If I run cmk --debug -vvn nodename I get all the info everytime I run the command just fine.
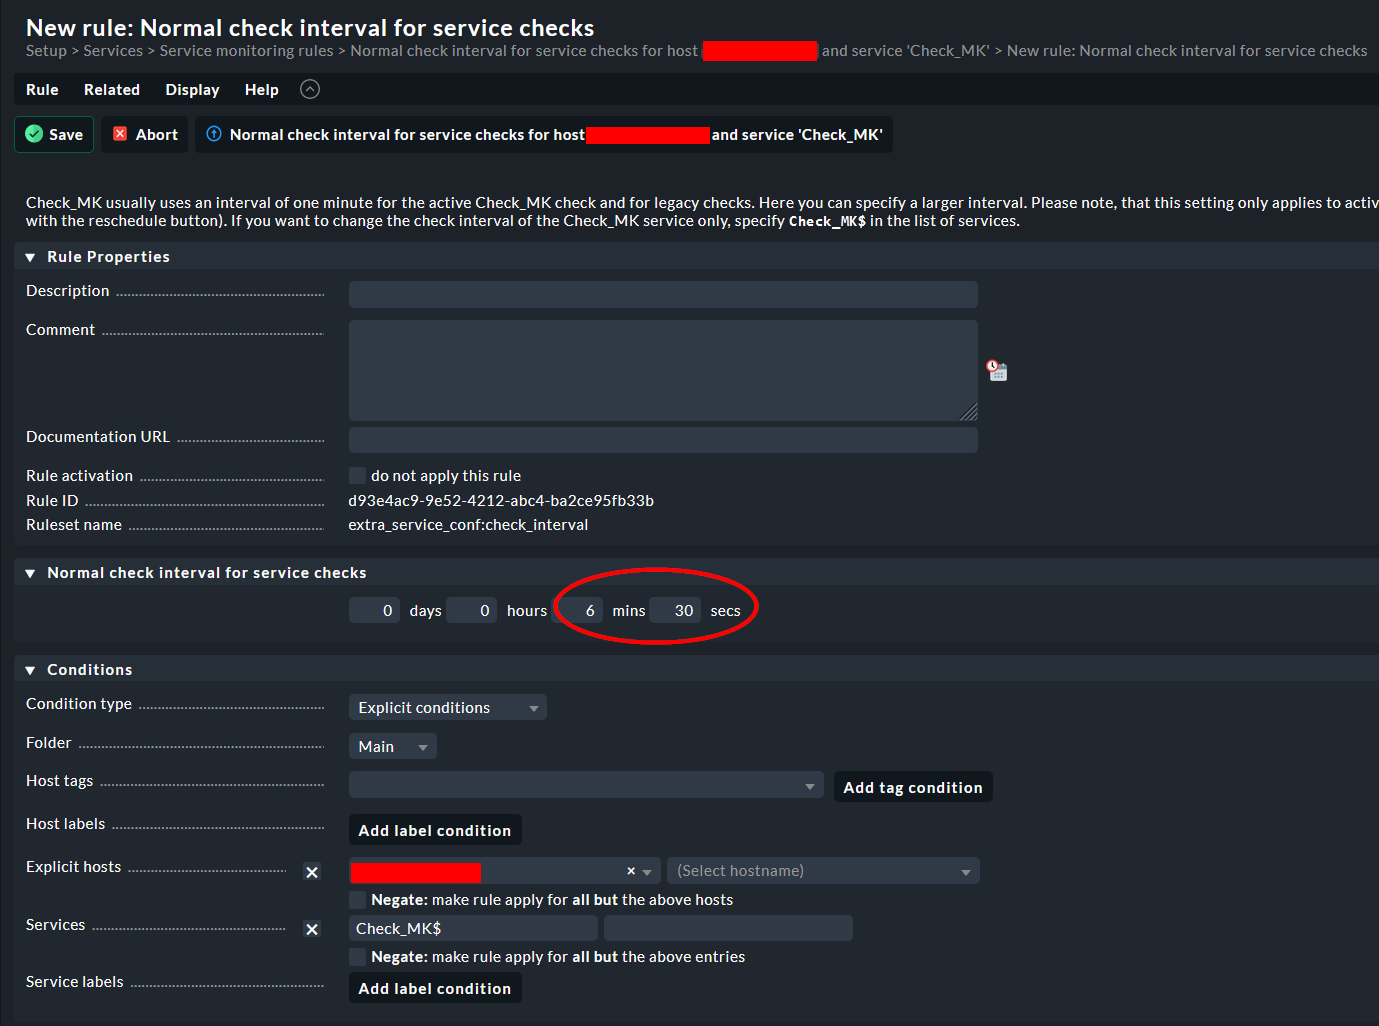
Is there a way to make the agent check less sensitive ?
Thanks!
Debug output sample:
Checkmk version 2.1.0p2
Try license usage history update.
Trying to acquire lock on /omd/sites/cmksite/var/check_mk/license_usage/next_run
Got lock on /omd/sites/cmksite/var/check_mk/license_usage/next_run
Trying to acquire lock on /omd/sites/cmksite/var/check_mk/license_usage/history.json
Got lock on /omd/sites/cmksite/var/check_mk/license_usage/history.json
Next run time has not been reached yet. Abort.
Releasing lock on /omd/sites/cmksite/var/check_mk/license_usage/history.json
Released lock on /omd/sites/cmksite/var/check_mk/license_usage/history.json
Releasing lock on /omd/sites/cmksite/var/check_mk/license_usage/next_run
Released lock on /omd/sites/cmksite/var/check_mk/license_usage/next_run
+ FETCHING DATA
  Source: SourceType.HOST/FetcherType.TCP
[cpu_tracking] Start [7fc154c7a490]
[TCPFetcher] Fetch with cache settings: DefaultAgentFileCache(hostame.tld, base_path=/omd/sites/cmksite/tmp/check_mk/cache, max_age=MaxAge(checking=0, discovery=120, inventory=120), disabled=False, use_outdated=False, simulation=False)
Not using cache (Too old. Age is 37 sec, allowed is 0 sec)
[TCPFetcher] Execute data source
Connecting via TCP to xxx.xxx.xxx.xxx:6556 (10.0s timeout)
Detected transport protocol: TransportProtocol.PLAIN (b'<<')
Reading data from agent
Write data to cache file /omd/sites/cmksite/tmp/check_mk/cache/hostame.tld
Trying to acquire lock on /omd/sites/cmksite/tmp/check_mk/cache/hostame.tld
Got lock on /omd/sites/cmksite/tmp/check_mk/cache/hostame.tld
Releasing lock on /omd/sites/cmksite/tmp/check_mk/cache/hostame.tld
Released lock on /omd/sites/cmksite/tmp/check_mk/cache/hostame.tld
Closing TCP connection to xxx.xxx.xxx.xxx:6556
[cpu_tracking] Stop [7fc154c7a490 - Snapshot(process=posix.times_result(user=0.0, system=0.009999999999999995, children_user=0.0, children_system=0.0, elapsed=1.9500000001862645))]
  Source: SourceType.HOST/FetcherType.PIGGYBACK
[cpu_tracking] Start [7fc154c7a880]
[PiggybackFetcher] Fetch with cache settings: NoCache(hostame.tld, base_path=/omd/sites/cmksite/tmp/check_mk/data_source_cache/piggyback, max_age=MaxAge(checking=0, discovery=120, inventory=120), disabled=True, use_outdated=False, simulation=False)
Not using cache (Cache usage disabled)
[PiggybackFetcher] Execute data source
No piggyback files for 'hostame.tld'. Skip processing.
No piggyback files for 'xxx.xxx.xxx.xxx'. Skip processing.
Not using cache (Cache usage disabled)
[cpu_tracking] Stop [7fc154c7a880 - Snapshot(process=posix.times_result(user=0.0, system=0.0, children_user=0.0, children_system=0.0, elapsed=0.0))]
+ PARSE FETCHER RESULTS
  Source: SourceType.HOST/FetcherType.TCP
<<<check_mk>>> / Transition NOOPParser -> HostSectionParser
<<<cmk_agent_ctl_status:sep(0)>>> / Transition HostSectionParser -> HostSectionParser
<<<checkmk_agent_plugins_lnx:sep(0)>>> / Transition HostSectionParser -> HostSectionParser
<<<labels:sep(0)>>> / Transition HostSectionParser -> HostSectionParser
<<<df>>> / Transition HostSectionParser -> HostSectionParser
<<<df>>> / Transition HostSectionParser -> HostSectionParser
<<<systemd_units>>> / Transition HostSectionParser -> HostSectionParser
<<<nfsmounts>>> / Transition HostSectionParser -> HostSectionParser
<<<cifsmounts>>> / Transition HostSectionParser -> HostSectionParser
<<<mounts>>> / Transition HostSectionParser -> HostSectionParser
<<<ps_lnx>>> / Transition HostSectionParser -> HostSectionParser
<<<mem>>> / Transition HostSectionParser -> HostSectionParser
<<<cpu>>> / Transition HostSectionParser -> HostSectionParser
<<<uptime>>> / Transition HostSectionParser -> HostSectionParser
<<<lnx_if>>> / Transition HostSectionParser -> HostSectionParser
<<<lnx_if:sep(58)>>> / Transition HostSectionParser -> HostSectionParser
<<<tcp_conn_stats>>> / Transition HostSectionParser -> HostSectionParser
<<<multipath>>> / Transition HostSectionParser -> HostSectionParser
<<<diskstat>>> / Transition HostSectionParser -> HostSectionParser
<<<kernel>>> / Transition HostSectionParser -> HostSectionParser
<<<md>>> / Transition HostSectionParser -> HostSectionParser
<<<vbox_guest>>> / Transition HostSectionParser -> HostSectionParser
<<<job>>> / Transition HostSectionParser -> HostSectionParser
<<<timesyncd>>> / Transition HostSectionParser -> HostSectionParser
<<<local:sep(0)>>> / Transition HostSectionParser -> HostSectionParser
<<<mtr:sep(124)>>> / Transition HostSectionParser -> HostSectionParser
<<<netstat>>> / Transition HostSectionParser -> HostSectionParser
<<<filehandler:cached(1655234881,300)>>> / Transition HostSectionParser -> HostSectionParser
<<<filestats:cached(1655234881,300):sep(0)>>> / Transition HostSectionParser -> HostSectionParser
<<<logins:cached(1655234821,300)>>> / Transition HostSectionParser -> HostSectionParser
<<<logwatch:cached(1655234821,300)>>> / Transition HostSectionParser -> HostSectionParser
<<<sshd_config:cached(1655234821,300)>>> / Transition HostSectionParser -> HostSectionParser
<<<apt:cached(1655228507,86400):sep(0)>>> / Transition HostSectionParser -> HostSectionParser
No persisted sections
  -> Add sections: ['apt', 'check_mk', 'checkmk_agent_plugins_lnx', 'cifsmounts', 'cmk_agent_ctl_status', 'cpu', 'df', 'diskstat', 'filehandler', 'filestats', 'job', 'kernel', 'labels', 'lnx_if', 'local', 'logins', 'logwatch', 'md', 'mem', 'mounts', 'mtr', 'multipath', 'netstat', 'nfsmounts', 'ps_lnx', 'sshd_config', 'systemd_units', 'tcp_conn_stats', 'timesyncd', 'uptime', 'vbox_guest']
  Source: SourceType.HOST/FetcherType.PIGGYBACK
No persisted sections
  -> Add sections: []
Received no piggyback data
Received no piggyback data
[cpu_tracking] Start [7fc154c45c40]
value store: synchronizing
Trying to acquire lock on /omd/sites/cmksite/tmp/check_mk/counters/hostame.tld
Got lock on /omd/sites/cmksite/tmp/check_mk/counters/hostame.tld
value store: loading from disk
Releasing lock on /omd/sites/cmksite/tmp/check_mk/counters/hostame.tld
Released lock on /omd/sites/cmksite/tmp/check_mk/counters/hostame.tld
CPU load             15 min load: 0.00, 15 min load per core: 0.00 (8 cores)
CPU utilization      Total CPU: 1.20%
Disk IO SUMMARY      Read: 0.00 B/s, Write: 67.1 kB/s, Latency: 849 microseconds
Filehandler          0.0% used (1632 of 9223372036854775807 file handles)
Filesystem /         10.55% used (8.30 of 78.69 GB), trend: +34.77 MB / 24 hours
Interface 2          [enp0s16], (up), MAC: 3E:0B:24:71:BD:01, Speed: unknown, In: 31.8 kB/s, Out: 18.3 kB/s
Kernel Performance   Process Creations: 7.15/s, Context Switches: 490.80/s, Major Page Faults: 0.00/s, Page Swap in: 0.00/s, Page Swap Out: 0.00/s
Logins               On system: 0
Memory               Total virtual memory: 62.02% - 4.82 GB of 7.77 GB, 8 additional details available
Mount options of /   Mount options exactly as expected
Number of threads    382, Usage: 0.61%
SSH daemon configuration ChallengeResponseAuthentication: no, UsePAM: yes, X11Forwarding: yes, PermitRootLogin: noyes
Systemd Timesyncd Time Offset: 1 microsecond, Time since last sync: 15 minutes 18 seconds, Stratum: 1.00, Jitter: Jan 01 1970 01:00:00, Synchronized on 216.239.35.0
TCP Connections      Established: 93
Uptime               Up since Jun 08 2022 19:35:21, Uptime: 6 days 1 hour
No piggyback files for 'hostame.tld'. Skip processing.
No piggyback files for 'xxx.xxx.xxx.xxx'. Skip processing.
[cpu_tracking] Stop [7fc154c45c40 - Snapshot(process=posix.times_result(user=0.020000000000000018, system=0.0, children_user=0.0, children_system=0.0, elapsed=0.02000000048428774))]
[agent] Success, execution time 2.0 sec | execution_time=1.970 user_time=0.020 system_time=0.010 children_user_time=0.000 children_system_time=0.000 cmk_time_agent=1.940