2.1.0p16
CentOS 8
[agent] Communication failed: [Errno 104] Connection reset by peerCRIT, Got no information from hostCRIT, execution time 0.5 sec
2.1.0p16
CentOS 8
[agent] Communication failed: [Errno 104] Connection reset by peerCRIT, Got no information from hostCRIT, execution time 0.5 sec
Hi!
Possibility to troubleshoot:
connect to your check_mk server as user [site of instanz] (putty, ssh)
Type cmk -v -D [hostname you want to monitor]
What is the result?
Best regards
Please check the below result.
[root@entomd ~]# cmk -v -D NTUSAPP2020
bash: cmk: command not found…
Failed to search for file: Failed to load /etc/yum.repos.d/naemon-stable.repo: Key file does not start with a group
[root@entomd ~]#
Root can not do this. To switch the user type
su - [name of check_mk instanz] + enter
when you switched to the user [name of check_mk instanz] type
cmk -v -D [hostname you want to monitor]
Some data has been mark as *. Please check the below result
OMD[monitoring]:~$ cmk -v -D ****************
Addresses: ****************
Tags: [address_family:ip-v4-only], [agent:cmk-agent], [checkmk-agent:checkmk-agent], [criticality:prod], [ip-v4:ip-v4], [networking:lan], [piggyback:auto-piggyback], [site:monitoring], [snmp_ds:no-snmp], [tcp:tcp]
Labels: [cmk/os_family:windows], [cmk/piggyback_source_************:yes], [cmk/site:monitoring], [cmk/vsphere_object:vm]
Host groups: On-Prem-Server
Contact groups: check-mk-notify, all
Agent mode: Normal Checkmk agent, or special agent if configured
Type of agent:
TCP: :6556
Process piggyback data from /omd/sites/monitoring/tmp/check_mk/piggyback/
Services:
checktype item params description groups
winperf_processor_util None Timespecific parameters at 2023-01-02 16:26:19: {‘average’: 15, ‘util’: (90.0, 95.0)} CPU utilization
checkmk_agent None Timespecific parameters at 2023-01-02 16:26:19: {‘agent_version’: (‘site’, {}), ‘restricted_address_mismatch’: 1, ‘legacy_pull_mode’: 0, ‘agent_version_missmatch’: 1} Check_MK Agent
df C:/ Timespecific parameters at 2023-01-02 16:26:19: {‘levels’: (90.0, 95.0), ‘magic_normsize’: 20, ‘levels_low’: (50.0, 60.0), ‘trend_range’: 24, ‘trend_perfdata’: True, ‘show_levels’: ‘onmagic’, ‘inodes_levels’: (10.0, 5.0), ‘show_inodes’: ‘onlow’, ‘show_reserved’: False, ‘mountpoint_for_block_devices’: ‘volume_name’, ‘item_appearance’: ‘mountpoint’} Filesystem C:/
df D:/ Timespecific parameters at 2023-01-02 16:26:19: {‘levels’: (90.0, 95.0), ‘magic_normsize’: 20, ‘levels_low’: (50.0, 60.0), ‘trend_range’: 24, ‘trend_perfdata’: True, ‘show_levels’: ‘onmagic’, ‘inodes_levels’: (10.0, 5.0), ‘show_inodes’: ‘onlow’, ‘show_reserved’: False, ‘mountpoint_for_block_devices’: ‘volume_name’, ‘item_appearance’: ‘mountpoint’} Filesystem D:/
winperf_if 1 Timespecific parameters at 2023-01-02 16:26:19: {‘traffic’: [(‘both’, (‘upper’, (‘perc’, (90.0, 95.0))))], ‘errors’: {‘both’: (‘perc’, (0.01, 0.1))}, ‘discovered_oper_status’: [‘1’], ‘discovered_speed’: 10000000000} Interface 1
winperf_if 2 Timespecific parameters at 2023-01-02 16:26:19: {‘traffic’: [(‘both’, (‘upper’, (‘perc’, (90.0, 95.0))))], ‘errors’: {‘both’: (‘perc’, (0.01, 0.1))}, ‘discovered_oper_status’: [‘1’], ‘discovered_speed’: 100000} Interface 2
mem_win None Timespecific parameters at 2023-01-02 16:26:19: {‘memory’: (90.0, 95.0), ‘pagefile’: (90.0, 95.0)} Memory
systemtime None Timespecific parameters at 2023-01-02 16:26:19: {‘levels’: (45, 60)} System Time
uptime None Timespecific parameters at 2023-01-02 16:26:19: {}
Hi,
try opening port 6556 of the monitored host
You can use e.g. ‘nc ip_address 6556’ or telnet or other things.
Best regards
Dennis
Hi,
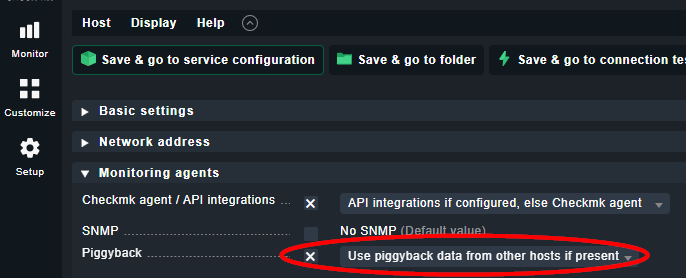
in your output are piggyback data available. You can monitor them when you atcivate piggyback for this host.
Best regards
Port 6556 open only.
I have tried Piggyback. But still I am facing the same issue.
Hmmm.
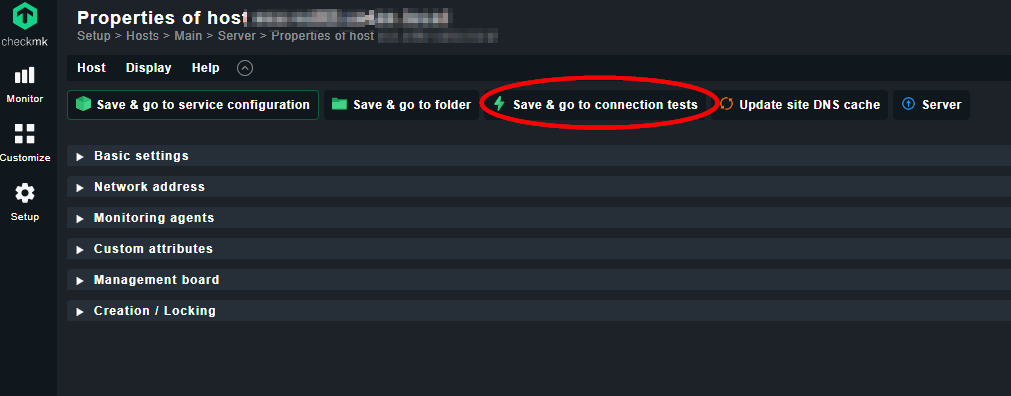
In my opinion the connection client <=> server should run, because you got the right output by the command “cmk -D”. So - my last idea to troubleshoot is to make the connection test after editing the properties of the host and look for the output - maybe you see something additional information about the problem. If you found a solution please post it.
Good luck!
This topic was automatically closed 365 days after the last reply. New replies are no longer allowed. Contact an admin if you think this should be re-opened.