Version: CEE 2.2.0p7
OS: Debian Linux 11.7
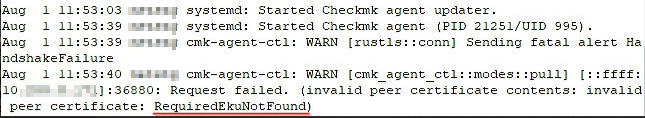
Error message: [agent] Communication failed: [SSL: SSLV3_ALERT_HANDSHAKE_FAILURE] sslv3 alert handshake failure (_ssl.c:2546)
Hi all,
we recently updated our distributed monitoring from 2.0.0p37 via latest 2.1.0 and 2.2.0p5, to 2.2.0p7.
I built new agents using the agent bakery, deployed them and enabled the TLS connection between all slaves and the master successfully.
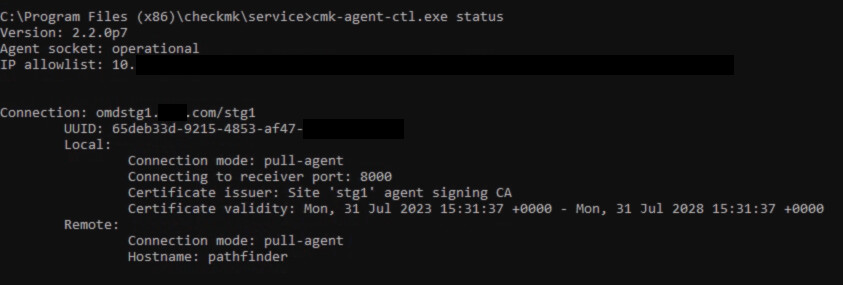
Now I tried to change the agent communication for several of our monitored hosts (Linux and Windows). It was always the same behavior for Linux and Windows clients. The registration against the corresponding slaves works fine and I can see with cmk-agent-ctl status, that the host is registered and in pull-mode now:
But the monitoring is not able to query the host anymore:

I reinstalled the agent manually and re-registered it multiple times, but nothing helped.
From the log in C:\ProgramData\checkmk\agent\log\check_mk.log:
2023-07-31 18:00:32.394 [ctl:4016] [cmk_agent_ctl::modes::pull][INFO] [::ffff:10.*.*.*]:48286: Handling pull request.
2023-07-31 18:00:32.418 [ctl:4016] [cmk_agent_ctl::modes::pull][DEBUG] [::ffff:10.*.*.*]:48286: Handling pull request DONE (Task detached).
2023-07-31 18:00:32.449 [ctl:4016] [cmk_agent_ctl::modes::pull][DEBUG] handle_request starts
2023-07-31 18:00:32.488 [srv 7448] Request is '::ffff:10.*.*.* Global\WinAgentCtl_4016_3324_0'
2023-07-31 18:00:32.515 [srv 7448] [Warn ] OHM file 'C:\ProgramData\checkmk\agent\bin\OpenHardwareMonitorCLI.exe' is not found
2023-07-31 18:00:32.517 [ctl:4016] [rustls::server::hs][DEBUG] decided upon suite TLS13_AES_256_GCM_SHA384
2023-07-31 18:00:32.543 [ctl:4016] [rustls::conn][WARN] Sending fatal alert HandshakeFailure
[...]
2023-07-31 18:00:36.731 [ctl:4016] [rustls::server::hs][DEBUG] decided upon suite TLS13_AES_256_GCM_SHA384
[...]
2023-07-31 18:00:42.059 [ctl:4016] [cmk_agent_ctl::modes::pull][DEBUG] processed task!
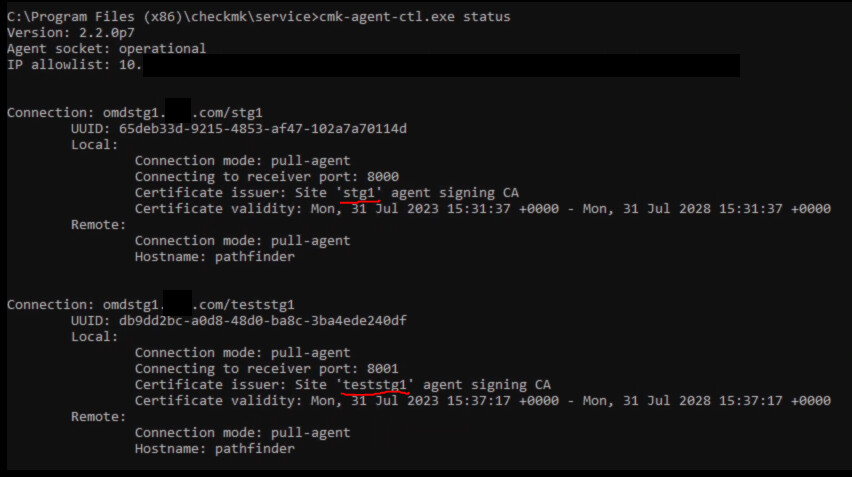
Then I tried to register the host to a second CMK site (teststg1), which is running on the same VM as the first site “stg1”. This instance was a copy of “stg1”, where we tested the upgrade steps, before we upgraded our PROD system). That worked also fine. So the host “pathfinder” is now registered to two different sites:
Now the fun part, I try to query from both sites (left: site stg1; right: site teststg1):
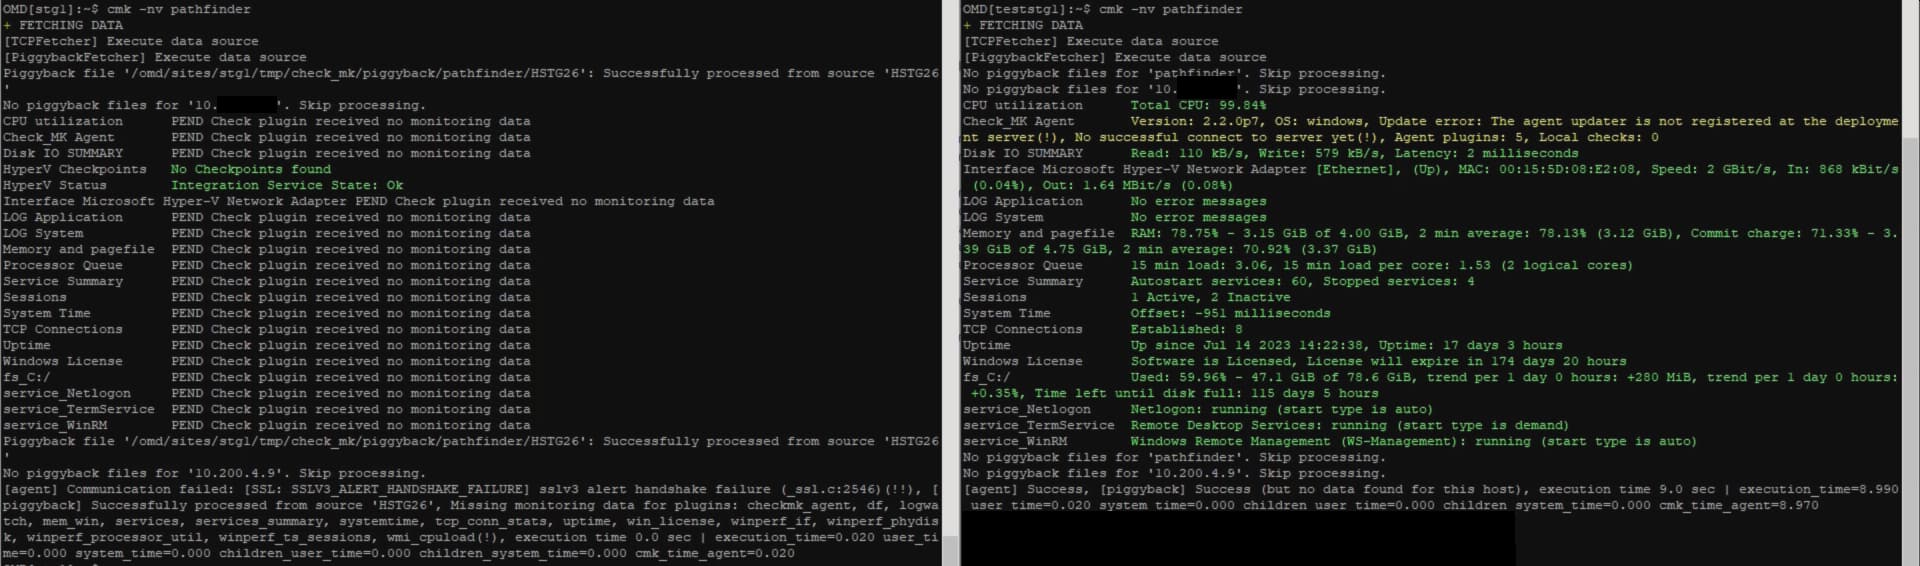
So the query works fine for the site “teststg1”, but fails for site “stg1” with the TLS handshake error.
Full output of Output of “cmk --debug -vvn pathfinder”: on site “stg1”:
OMD[stg1]:~$ cmk --debug -vvn pathfinder
Checkmk version 2.2.0p7
+ FETCHING DATA
  Source: SourceInfo(hostname='pathfinder', ipaddress='10.*.*.*', ident='agent', fetcher_type=<FetcherType.TCP: 8>, source_type=<SourceType.HOST: 1>)
[cpu_tracking] Start [7f39f7571b90]
Read from cache: AgentFileCache(pathfinder, path_template=/omd/sites/stg1/tmp/check_mk/cache/{hostname}, max_age=MaxAge(checking=0, discovery=120, inventory=120), simulation=False, use_only_cache=False, file_cache_mode=6)
Not using cache (does not exist)
[TCPFetcher] Execute data source
Connecting via TCP to 10.*.*.*:6556 (5.0s timeout)
Detected transport protocol: TransportProtocol.TLS (b'16')
Reading data from agent via TLS socket
Reading data from agent
Closing TCP connection to 10.*.*.*:6556
[cpu_tracking] Stop [7f39f7571b90 - Snapshot(process=posix.times_result(user=0.010000000000000009, system=0.0, children_user=0.0, children_system=0.0, elapsed=0.019999999552965164))]
  Source: SourceInfo(hostname='pathfinder', ipaddress='10.*.*.*', ident='piggyback', fetcher_type=<FetcherType.PIGGYBACK: 4>, source_type=<SourceType.HOST: 1>)
[cpu_tracking] Start [7f39f6601ed0]
Read from cache: NoCache(pathfinder, path_template=/dev/null, max_age=MaxAge(checking=0.0, discovery=0.0, inventory=0.0), simulation=False, use_only_cache=False, file_cache_mode=1)
[PiggybackFetcher] Execute data source
Piggyback file '/omd/sites/stg1/tmp/check_mk/piggyback/pathfinder/HSTG26': Successfully processed from source 'HSTG26'
No piggyback files for '10.*.*.*'. Skip processing.
[cpu_tracking] Stop [7f39f6601ed0 - Snapshot(process=posix.times_result(user=0.0, system=0.0, children_user=0.0, children_system=0.0, elapsed=0.0))]
+ PARSE FETCHER RESULTS
<<<hyperv_vmstatus:cached(1690820202,90)>>> / Transition NOOPParser -> HostSectionParser
<<<hyperv_checkpoints:cached(1690820202,90)>>> / Transition HostSectionParser -> HostSectionParser
<<<labels:sep(0)>>> / Transition HostSectionParser -> HostSectionParser
No persisted sections
  HostKey(hostname='pathfinder', source_type=<SourceType.HOST: 1>)  -> Not adding sections: SSLError(1, '[SSL: SSLV3_ALERT_HANDSHAKE_FAILURE] sslv3 alert handshake failure (_ssl.c:2546)')
  HostKey(hostname='pathfinder', source_type=<SourceType.HOST: 1>)  -> Add sections: ['hyperv_checkpoints', 'hyperv_vmstatus', 'labels']
Received no piggyback data
[cpu_tracking] Start [7f39f620fb90]
value store: synchronizing
Trying to acquire lock on /omd/sites/stg1/tmp/check_mk/counters/pathfinder
Got lock on /omd/sites/stg1/tmp/check_mk/counters/pathfinder
value store: loading from disk
Releasing lock on /omd/sites/stg1/tmp/check_mk/counters/pathfinder
Released lock on /omd/sites/stg1/tmp/check_mk/counters/pathfinder
CPU utilization      PEND Check plugin received no monitoring data
Check_MK Agent       PEND Check plugin received no monitoring data
Disk IO SUMMARY      PEND Check plugin received no monitoring data
HyperV Checkpoints   No Checkpoints found
HyperV Status        Integration Service State: Ok
Interface Microsoft Hyper-V Network Adapter PEND Check plugin received no monitoring data
LOG Application      PEND Check plugin received no monitoring data
LOG System           PEND Check plugin received no monitoring data
Memory and pagefile  PEND Check plugin received no monitoring data
Processor Queue      PEND Check plugin received no monitoring data
Service Summary      PEND Check plugin received no monitoring data
Sessions             PEND Check plugin received no monitoring data
System Time          PEND Check plugin received no monitoring data
TCP Connections      PEND Check plugin received no monitoring data
Uptime               PEND Check plugin received no monitoring data
Windows License      PEND Check plugin received no monitoring data
fs_C:/               PEND Check plugin received no monitoring data
service_Netlogon     PEND Check plugin received no monitoring data
service_TermService  PEND Check plugin received no monitoring data
service_WinRM        PEND Check plugin received no monitoring data
Piggyback file '/omd/sites/stg1/tmp/check_mk/piggyback/pathfinder/HSTG26': Successfully processed from source 'HSTG26'
No piggyback files for '10.*.*.*'. Skip processing.
[cpu_tracking] Stop [7f39f620fb90 - Snapshot(process=posix.times_result(user=0.010000000000000009, system=0.0, children_user=0.0, children_system=0.0, elapsed=0.010000001639127731))]
[agent] SSLError(1, '[SSL: SSLV3_ALERT_HANDSHAKE_FAILURE] sslv3 alert handshake failure (_ssl.c:2546)')(!!), [piggyback] Successfully processed from source 'HSTG26', Missing monitoring data for plugins: checkmk_agent, df, logwatch, mem_win, services, services_summary, systemtime, tcp_conn_stats, uptime, win_license, winperf_if, winperf_phydisk, winperf_processor_util, winperf_ts_sessions, wmi_cpuload(!), execution time 0.0 sec | execution_time=0.030 user_time=0.020 system_time=0.000 children_user_time=0.000 children_system_time=0.000 cmk_time_agent=0.010
Full output of Output of “cmk --debug -vvn pathfinder”: on site “teststg1”:
OMD[teststg1]:~$ cmk --debug -vvn pathfinder
Checkmk version 2.2.0p7
+ FETCHING DATA
  Source: SourceInfo(hostname='pathfinder', ipaddress='10.*.*.*', ident='agent', fetcher_type=<FetcherType.TCP: 8>, source_type=<SourceType.HOST: 1>)
[cpu_tracking] Start [7f995e226190]
Read from cache: AgentFileCache(pathfinder, path_template=/omd/sites/teststg1/tmp/check_mk/cache/{hostname}, max_age=MaxAge(checking=0, discovery=120, inventory=120), simulation=False, use_only_cache=False, file_cache_mode=6)
Not using cache (Too old. Age is 49 sec, allowed is 0 sec)
[TCPFetcher] Execute data source
Connecting via TCP to 10.*.*.*:6556 (5.0s timeout)
Detected transport protocol: TransportProtocol.TLS (b'16')
Reading data from agent via TLS socket
Reading data from agent
Detected transport protocol: TransportProtocol.PLAIN (b'<<')
Closing TCP connection to 10.*.*.*:6556
Write data to cache file /omd/sites/teststg1/tmp/check_mk/cache/pathfinder
Trying to acquire lock on /omd/sites/teststg1/tmp/check_mk/cache/pathfinder
Got lock on /omd/sites/teststg1/tmp/check_mk/cache/pathfinder
Releasing lock on /omd/sites/teststg1/tmp/check_mk/cache/pathfinder
Released lock on /omd/sites/teststg1/tmp/check_mk/cache/pathfinder
[cpu_tracking] Stop [7f995e226190 - Snapshot(process=posix.times_result(user=0.0, system=0.0, children_user=0.0, children_system=0.0, elapsed=5.300000000745058))]
  Source: SourceInfo(hostname='pathfinder', ipaddress='10.*.*.*', ident='piggyback', fetcher_type=<FetcherType.PIGGYBACK: 4>, source_type=<SourceType.HOST: 1>)
[cpu_tracking] Start [7f995c70ddd0]
Read from cache: NoCache(pathfinder, path_template=/dev/null, max_age=MaxAge(checking=0.0, discovery=0.0, inventory=0.0), simulation=False, use_only_cache=False, file_cache_mode=1)
[PiggybackFetcher] Execute data source
No piggyback files for 'pathfinder'. Skip processing.
No piggyback files for '10.*.*.*'. Skip processing.
[cpu_tracking] Stop [7f995c70ddd0 - Snapshot(process=posix.times_result(user=0.0, system=0.0, children_user=0.0, children_system=0.0, elapsed=0.0))]
+ PARSE FETCHER RESULTS
<<<check_mk>>> / Transition NOOPParser -> HostSectionParser
<<<cmk_agent_ctl_status:sep(0)>>> / Transition HostSectionParser -> HostSectionParser
<<<wmi_cpuload:sep(124)>>> / Transition HostSectionParser -> HostSectionParser
<<<df:sep(9)>>> / Transition HostSectionParser -> HostSectionParser
<<<uptime>>> / Transition HostSectionParser -> HostSectionParser
<<<fileinfo:sep(124)>>> / Transition HostSectionParser -> HostSectionParser
<<<mem>>> / Transition HostSectionParser -> HostSectionParser
<<<services>>> / Transition HostSectionParser -> HostSectionParser
<<<logwatch>>> / Transition HostSectionParser -> HostSectionParser
<<<winperf_phydisk>>> / Transition HostSectionParser -> HostSectionParser
<<<winperf_if>>> / Transition HostSectionParser -> HostSectionParser
<<<winperf_processor>>> / Transition HostSectionParser -> HostSectionParser
<<<winperf_tcp_conn>>> / Transition HostSectionParser -> HostSectionParser
<<<winperf_ts_sessions>>> / Transition HostSectionParser -> HostSectionParser
<<<checkmk_agent_plugins_win:sep(0)>>> / Transition HostSectionParser -> HostSectionParser
<<<dotnet_clrmemory:sep(124)>>> / Transition HostSectionParser -> HostSectionParser
<<<ps:sep(9)>>> / Transition HostSectionParser -> HostSectionParser
Transition HostSectionParser -> NOOPParser
<<<winperf_if_teaming:sep(9)>>> / Transition NOOPParser -> HostSectionParser
<<<winperf_if_get_netadapter:sep(124)>>> / Transition HostSectionParser -> HostSectionParser
<<<win_license>>> / Transition HostSectionParser -> HostSectionParser
<<<cmk_update_agent_status:cached(1690816779,3600):sep(0)>>> / Transition HostSectionParser -> HostSectionParser
<<<win_netstat>>> / Transition HostSectionParser -> HostSectionParser
Transition HostSectionParser -> NOOPParser
<<<systemtime>>> / Transition NOOPParser -> HostSectionParser
No persisted sections
No persisted sections
  HostKey(hostname='pathfinder', source_type=<SourceType.HOST: 1>)  -> Add sections: ['check_mk', 'checkmk_agent_plugins_win', 'cmk_agent_ctl_status', 'cmk_update_agent_status', 'df', 'dotnet_clrmemory', 'fileinfo', 'logwatch', 'mem', 'ps', 'services', 'systemtime', 'uptime', 'win_license', 'win_netstat', 'winperf_if', 'winperf_if_get_netadapter', 'winperf_if_teaming', 'winperf_phydisk', 'winperf_processor', 'winperf_tcp_conn', 'winperf_ts_sessions', 'wmi_cpuload']
  HostKey(hostname='pathfinder', source_type=<SourceType.HOST: 1>)  -> Add sections: []
Received no piggyback data
[cpu_tracking] Start [7f995c74fed0]
value store: synchronizing
Trying to acquire lock on /omd/sites/teststg1/tmp/check_mk/counters/pathfinder
Got lock on /omd/sites/teststg1/tmp/check_mk/counters/pathfinder
value store: loading from disk
Releasing lock on /omd/sites/teststg1/tmp/check_mk/counters/pathfinder
Released lock on /omd/sites/teststg1/tmp/check_mk/counters/pathfinder
CPU utilization      Total CPU: 84.52%
Check_MK Agent       Version: 2.2.0p7, OS: windows, Update error: The agent updater is not registered at the deployment server(!), No successful connect to server yet(!), Agent plugins: 5, Local checks: 0
Disk IO SUMMARY      Read: 164 kB/s, Write: 1.13 MB/s, Latency: 6 milliseconds
Interface Microsoft Hyper-V Network Adapter [Ethernet], (Up), MAC: 00:15:5D:08:E2:08, Speed: 2 GBit/s, In: 892 kBit/s (0.04%), Out: 3.25 MBit/s (0.16%)
LOG Application      No error messages
LOG System           No error messages
Memory and pagefile  RAM: 84.32% - 3.37 GiB of 4.00 GiB, 2 min average: 84.16% (3.37 GiB), Commit charge: 76.18% - 3.62 GiB of 4.75 GiB, 2 min average: 75.56% (3.59 GiB)
Processor Queue      15 min load: 2.92, 15 min load per core: 1.46 (2 logical cores)
Service Summary      Autostart services: 60, Stopped services: 4
Sessions             1 Active, 2 Inactive
System Time          Offset: -38 milliseconds
TCP Connections      Established: 7
Uptime               Up since Jul 14 2023 14:22:39, Uptime: 17 days 3 hours
Windows License      Software is Licensed, License will expire in 174 days 19 hours
fs_C:/               Used: 59.97% - 47.1 GiB of 78.6 GiB, trend per 1 day 0 hours: +288 MiB, trend per 1 day 0 hours: +0.36%, Time left until disk full: 111 days 19 hours
service_Netlogon     Netlogon: running (start type is auto)
service_TermService  Remote Desktop Services: running (start type is demand)
service_WinRM        Windows Remote Management (WS-Management): running (start type is auto)
No piggyback files for 'pathfinder'. Skip processing.
No piggyback files for '10.*.*.*'. Skip processing.
[cpu_tracking] Stop [7f995c74fed0 - Snapshot(process=posix.times_result(user=0.010000000000000009, system=0.0, children_user=0.0, children_system=0.0, elapsed=0.019999999552965164))]
[agent] Success, [piggyback] Success (but no data found for this host), execution time 5.3 sec | execution_time=5.320 user_time=0.010 system_time=0.000 children_user_time=0.000 children_system_time=0.000 cmk_time_agent=5.300
To sum up: Two almost identical sites on one VM and one site can query a registered host with TLS, while the second site fails with a TLS handshake error.
Any ideas and clues are more than welcome!
Cheers Manuel