bjerre
(Simon Bjerre)
1
Dear forum.
I’m currently trying to build some dashboards for my operations team where the goal is to have these dashboards on a wall of monitors.
- The things I have noted as a must-have is an aggregated on a set of host
- CPU Load
- Memory used
- Total CPU cores
- Total Memory Available
- Network I/O on the primary interface
I have found a Grafana/ Prometheus dashboard that visualises this quite nicely
Where would I start building this? and with what toos?
cjcox
(Christopher Cox)
2
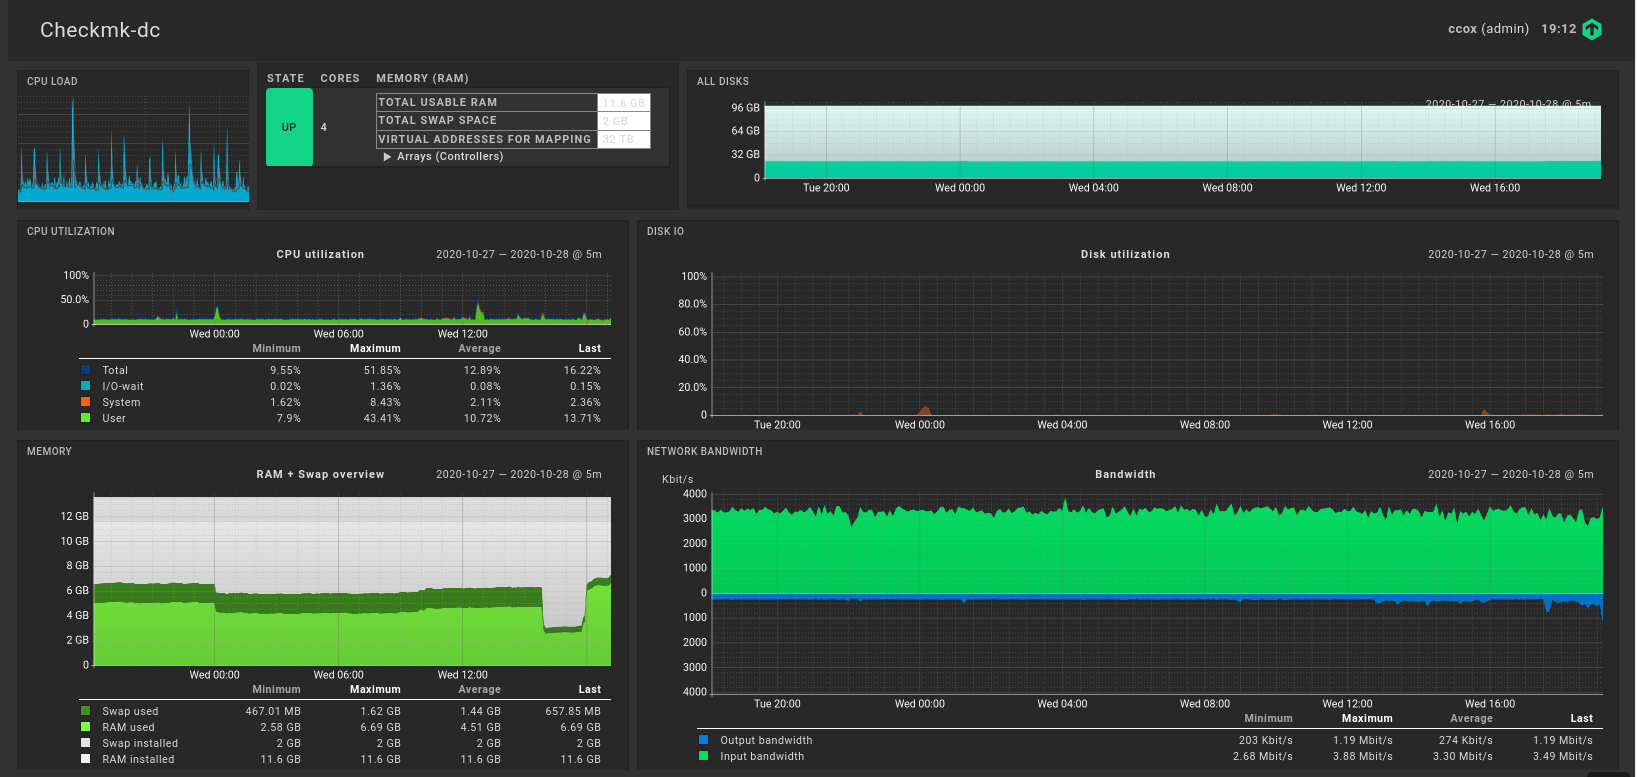
This might not be “pretty”, but quick and dirty using just what checkmk can do dashboard wise. Dashboard for my checkmk server called checkmk-dc.
1 Like
bjerre
(Simon Bjerre)
3
This is just for one host right?
Would it be possible to get this for multiple? or maby a host-groupe?
cjcox
(Christopher Cox)
4
Not sure how easy it is to replicate across hosts without a bit of effort.
system
(system)
Closed
5
This topic was automatically closed 365 days after the last reply. New replies are no longer allowed.