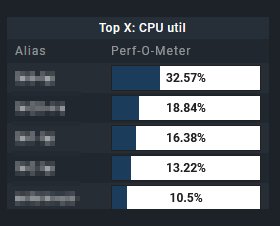
I’m using raw, which has less options for dashboards, so I don’t have a top 10 list element or something.
Basicly something similar can be achieved with custom view per utilization, which can be added as view to a dashboard.
- Copy existing service search view
Like the one that you see when going toMonitor > Overview > Service search - Customize view, give it a recognisable name.
- Columns:
Hosts: Host alias&Services: Service Perf-O-Meter - Sorting column:
Services: Service performance data - value number 1;Descending
this works for CPU Utilization, maybe for other services you need different value number item. - Context / Search Filters: the actual thing you want list for. So
Service: CPU Utilization - Save custom view.
- Add custom view as view to dashboard and give custom title
Top X: CPU utilization
The only thing I don’t know or find is to limit the view to only 10 results.
But maybe it can be cheated by making the element in the dashboard as high so it only fits 10 items. (-;
Edit:
Quickly made such a view and add it to a dashboard to illustrate my suggestion:
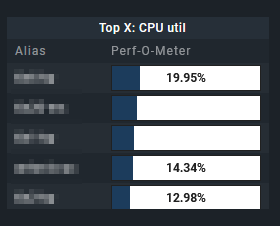
Host alias 2 & 3 are stale and therefor don’t show a percentage. So maybe I should have filtered out stale items in the Context / Search Filters part of the view.
No longer stale: