Is it possible to create a summary view/dashboard and apply this to all hosts?
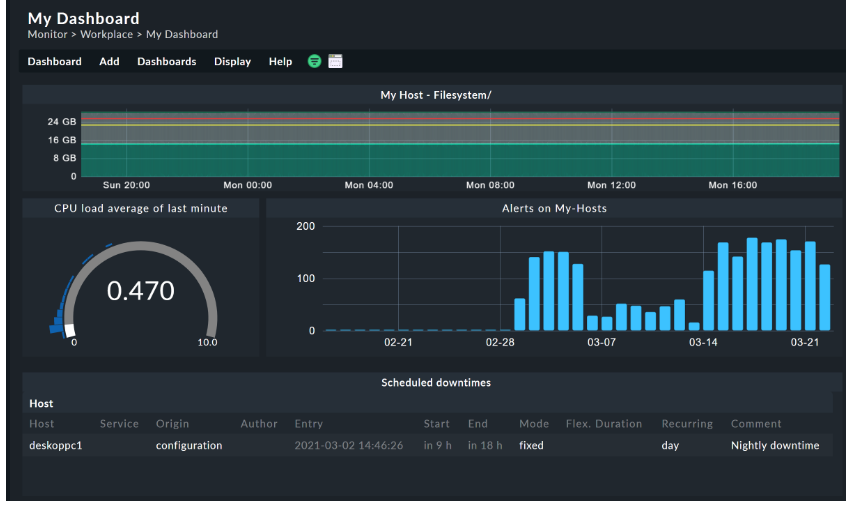
For example in the dashboard notes it talks about creating a dashboard with some graphs but in the example you must choose a specific host.
I want to know or find the relevant documentation that shows me how to create for example a different summary view/dashboard so when I click any host it will launch into this page (similar to what can be done in SolarWinds for example).
You could simply bookmark those, if that does the trick?
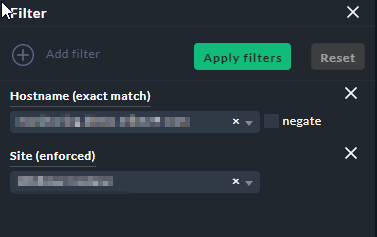
Of course, you could also use this as a starting point to build your own. Populate it using the filters:
and bookmark the resulting Dashboards. (Same for views)
I found out that we are on 2.0.0p23 (I don’t have access yet to log on and check).
Ok so what you’ve shown me above, does that mean in the latest version it’s possible to create host specific dashboards so when I click into any host it will show that dashboard view? (i.e apply this customised dashboard to hosts).
I was playing around this views and in the version we have the only way to do this I can see it to add a link to a customised dashboard in a view which isn’t ideal.
Well, the dashboard already exists, and you can populate it with data for every single host, using filters.
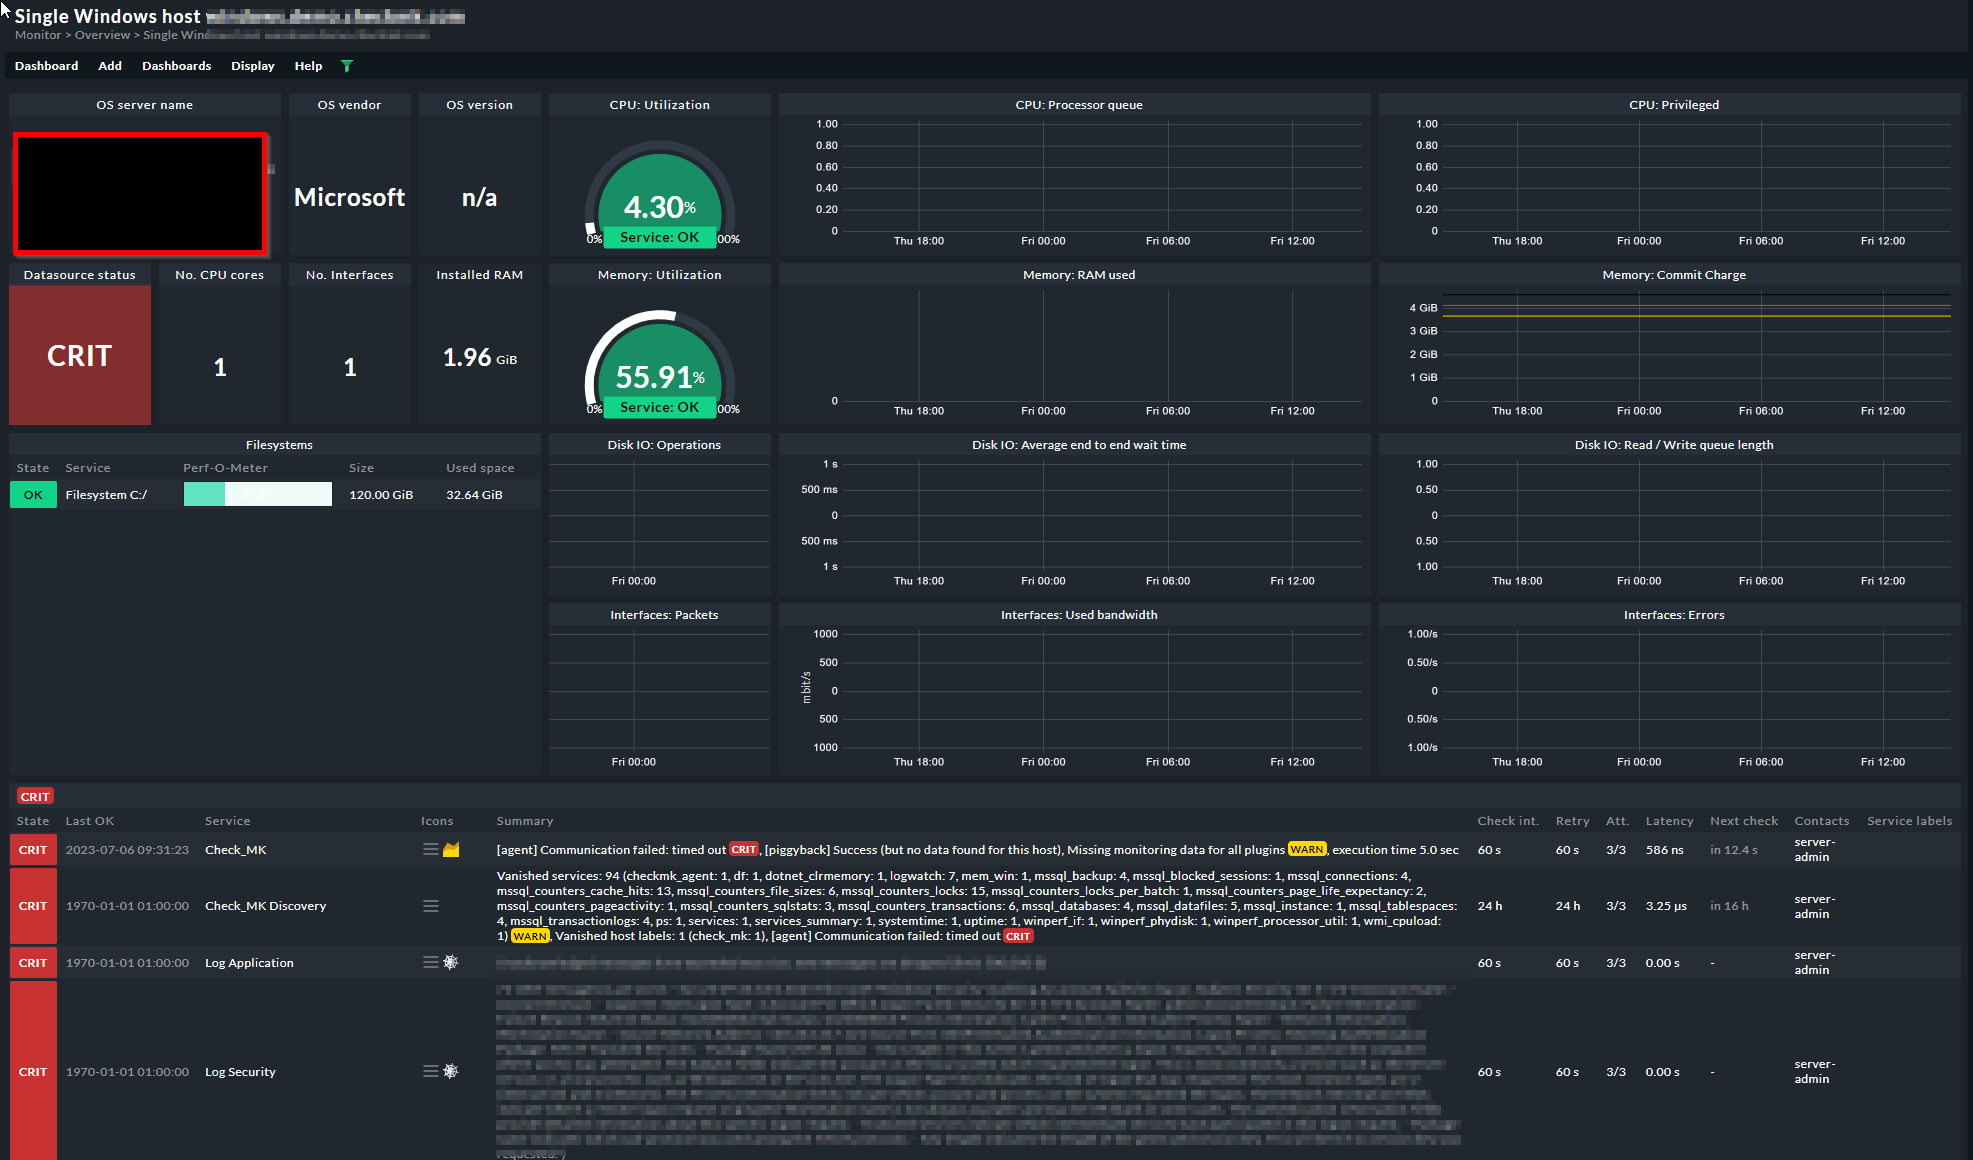
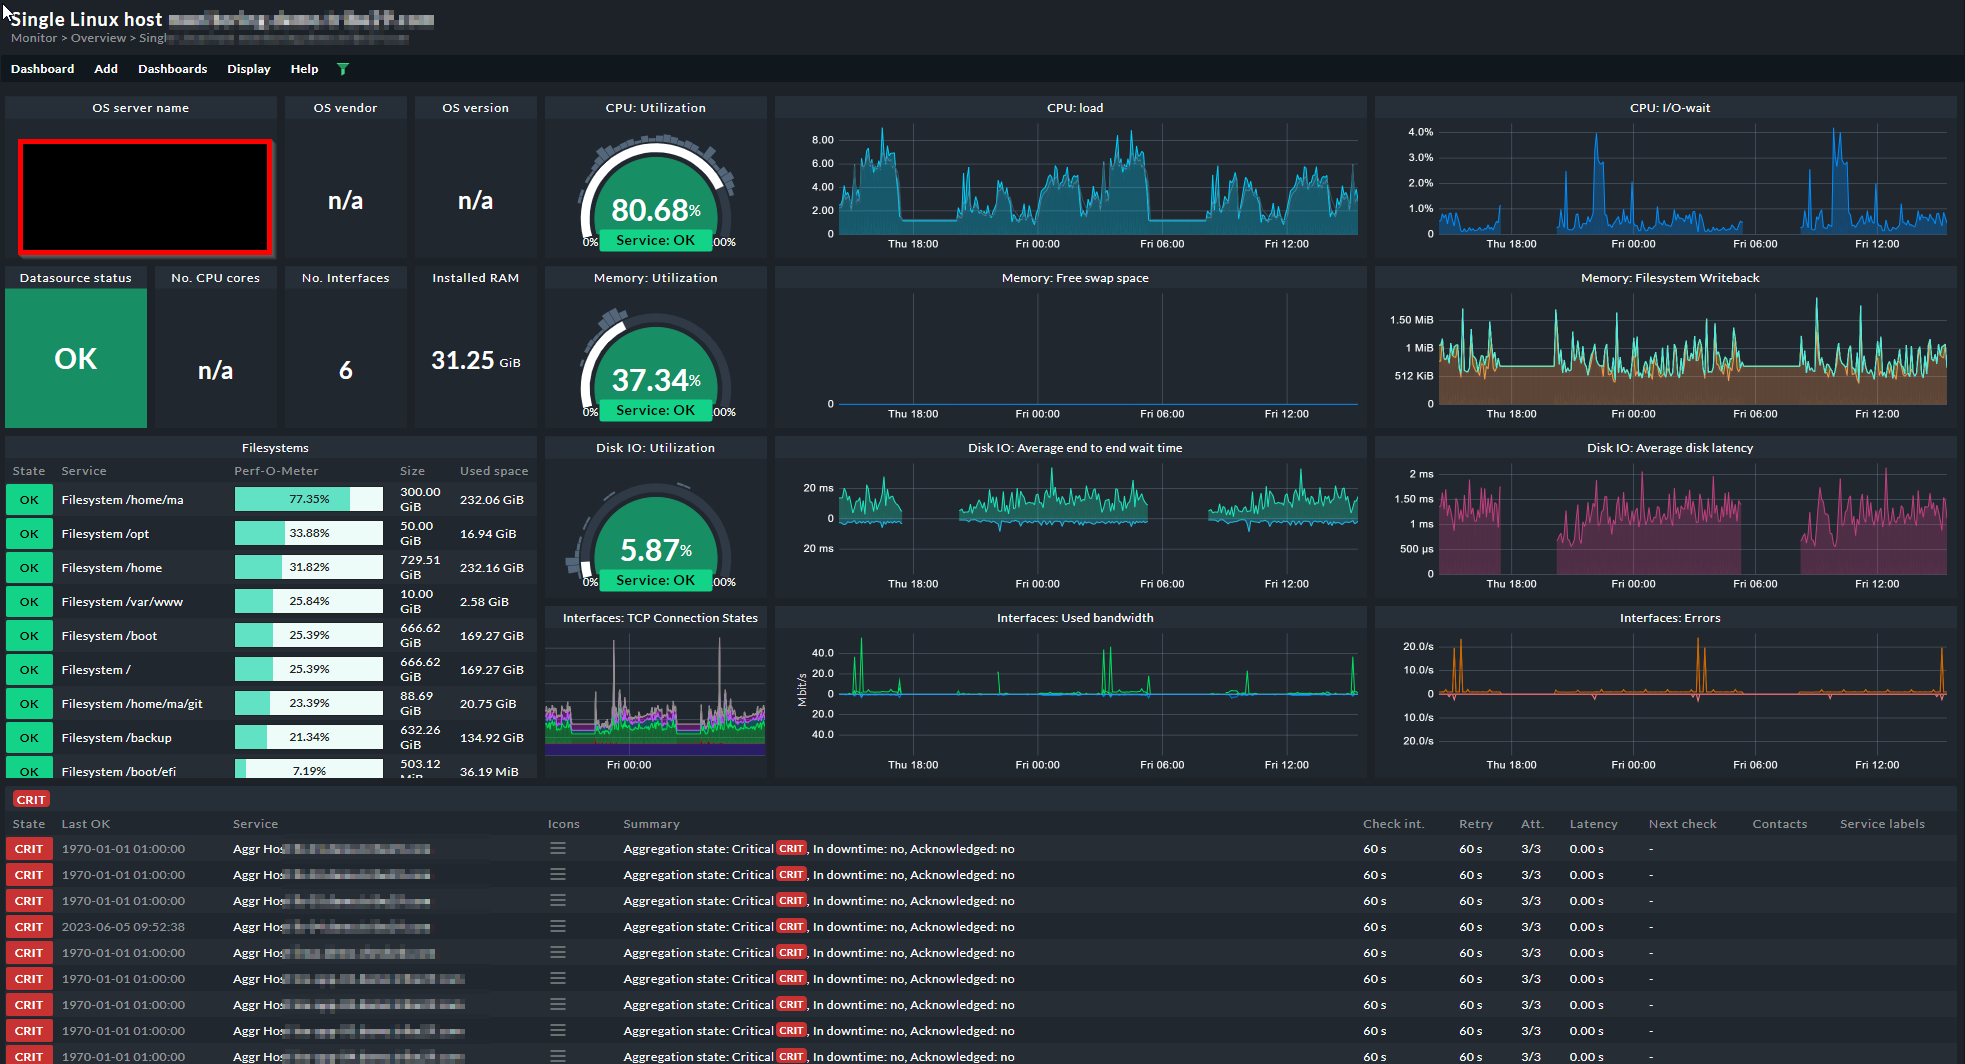
To get to that populated dashboard, the easiest is probably to bookmark it (use the bookmark sidepar snapin). You can also get to it from the “Linux Hosts” or “Windows Hosts” dashboard, by clicking on that host.
If you click on a host in the “All Hosts” view, for example, you still get to the “Services of Host xyz” view.
I’m not sure you understand what I mean or maybe i’m getting confused here myself.
When you click on any host in checkmk it takes you to a view for example the default view being ‘hosts’ which lists out services.
What I want to know is can we have a view/dashboard that appears whenever I click on ANY host that will show this summary page? (for example this one in the documentation) Dashboards (checkmk.com)
I can’t find a way of applying this customised dashboard to the views/hosts so when I click on a host I see this. Does that make sense?
The only way of currently doing this I can see is putting a link in the hosts page to that customised dashboard. But I want to see nice graphs when I click a host like the above.
I don’t think this can be done easily for any link to a given host. This would mean changing the destination for a lot of links that are created by checkmk.
My workaround would be using your bookmarks snapin for that.
So
you create the dashboard (you’ve already done that)
you use the filters to populate it with info from a given host
you bookmark the resulting populated dashboard.
But I’ll admit that it’s not perfect, because you can’t simply “click through” from, say the “All Hosts” view, but it’s the closest I can think of.
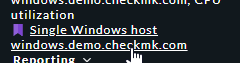
I don’t want to populate a customised dashboard to a specific host. I want to be able to click a host from the all hosts screen and for it to show me the CPU graph, C drive usage gauge and the alerts graph on the main hosts page.
Is this not possible?
When you click on a host it takes you to the VIEW.
Therefore the only way around this I can see if on the view just have a link to the customised dashboard.
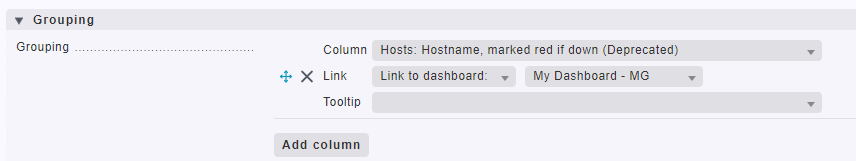
Is it possible in the below example to edit or enter code which says “IF host is Windows then link to Windows Single Host Dashboard OR If host is Linux then link to Linux Single Host Dashboard”?
Anyone else? Basically I need to know if it’s possible that when I click on a hostname in a custom view, depending on whether the node is for example Windows or Linux it’ll take me to the appropriate Linux/Windows single dashboard.
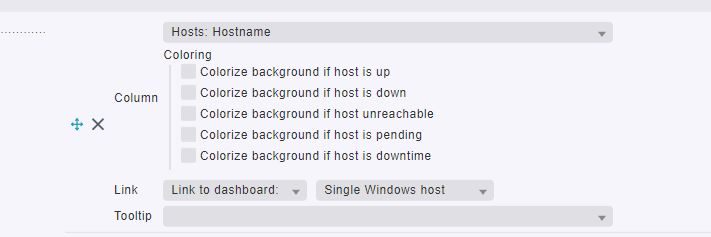
Currently in the image in my previous post it seems you can only link to one of the other based on hostname. But that means if I link to ‘Single Windows Host’ and click on a Linux host then it won’t bring back the correct dashboard (Single Linux Dashboard).
I know there is now the windows and Linux single host dashboards. But it would be nice to click a host in for example the all host screen and for it to then take you to the windows or Linux single dashboard if that makes sense?
And I can’t see a current way to do that using views unless there is that option I mentioned in previous post.
as far as I know, still not possible / non existing - @mgillespie1981
We also thought we are not the only ones who want to add a diferent view/dashboard behind a click (host/view/what ever is clickable)
Hi @mgillespie1981,
this is indeed not possible right now. Currently, only the hostname may passed-through as a context. Anyway, a solution could look like this:
I am (or: We are) aiming more on making it possible to have one dashboard for Linux/Windows/etc. This requires at the moment to be able to choose one metric or another. E.g. “cpu_load” or “processor_queue”. This would allow us to create views or time-series-graphs applying to different systems.
The ability to pass-through an arbitrary amount of object (host or service) properties to a next view or dashboard would actually be a very nice feature! From my perspective, this stands next to the above rather than excluding.
I would really like to have these two features (as it would make our life developing Checkmk). Unfortunately it’s not about my personal wishes, either. We have to balance this with a lot of other (very useful!) feature requests and ideas.
As a conclusion: We want it, too! It depends on several parameters, when these feature will be available.
PS: Until then, you could modify your dashboard to display OS agnostic data and add further “deep dive” dashboards to investigate specific services further. If you use the windows dashboard (Single Windows host), you need to change 4-5 elements to make it work on Windows and Linux. It’s not ideal, but a start.
PPS: We will add nothing on the (already released) 2.2.0
PPPS: Please be indulgent to us, as we will most likely not be able to tackle that on the upcoming 2.3.0
This topic was automatically closed 365 days after the last reply. New replies are no longer allowed. Contact an admin if you think this should be re-opened.