Are Kubernetes k8s CPU and Memory checks worthless ? check_mk-k8s_resources_cpu and check_mk-k8s_resources_memory

Kubernetes k8s checks and graphs for k8s Memory and CPU do not make any sense to me.

The graphs are just flat lines and just “Request: 0.250, Limit: 0.500” are plotted:


What I need and expect is something like the normal Memory and CPU utilization
like this:


We want to know/monitor how much RAM and CPU a pod is actually using.

Are we doing anything wrong, or are

check_mk-k8s_resources_cpu and
check_mk-k8s_resources_memory

are near to worthless ?

CMK version: 2.0.0p19 (CEE)

These checks only show what you can get from the k8s API. It’s the configured and the requested resources. That’s also most times the important information. You need to see if something uses more than the limit or if all consumers together break the limit of the host. The metrics cannot be compared to classic utilization checks.

I would not consider them worthless. These measurements are helpful in a dynamic environment, where you need to compare the requested against the physically available resources. Especially if autoscaling is used, they give a hint about workloads that reach the physical limits.

@Heavy & @andreas-doehler thanks for your replies.

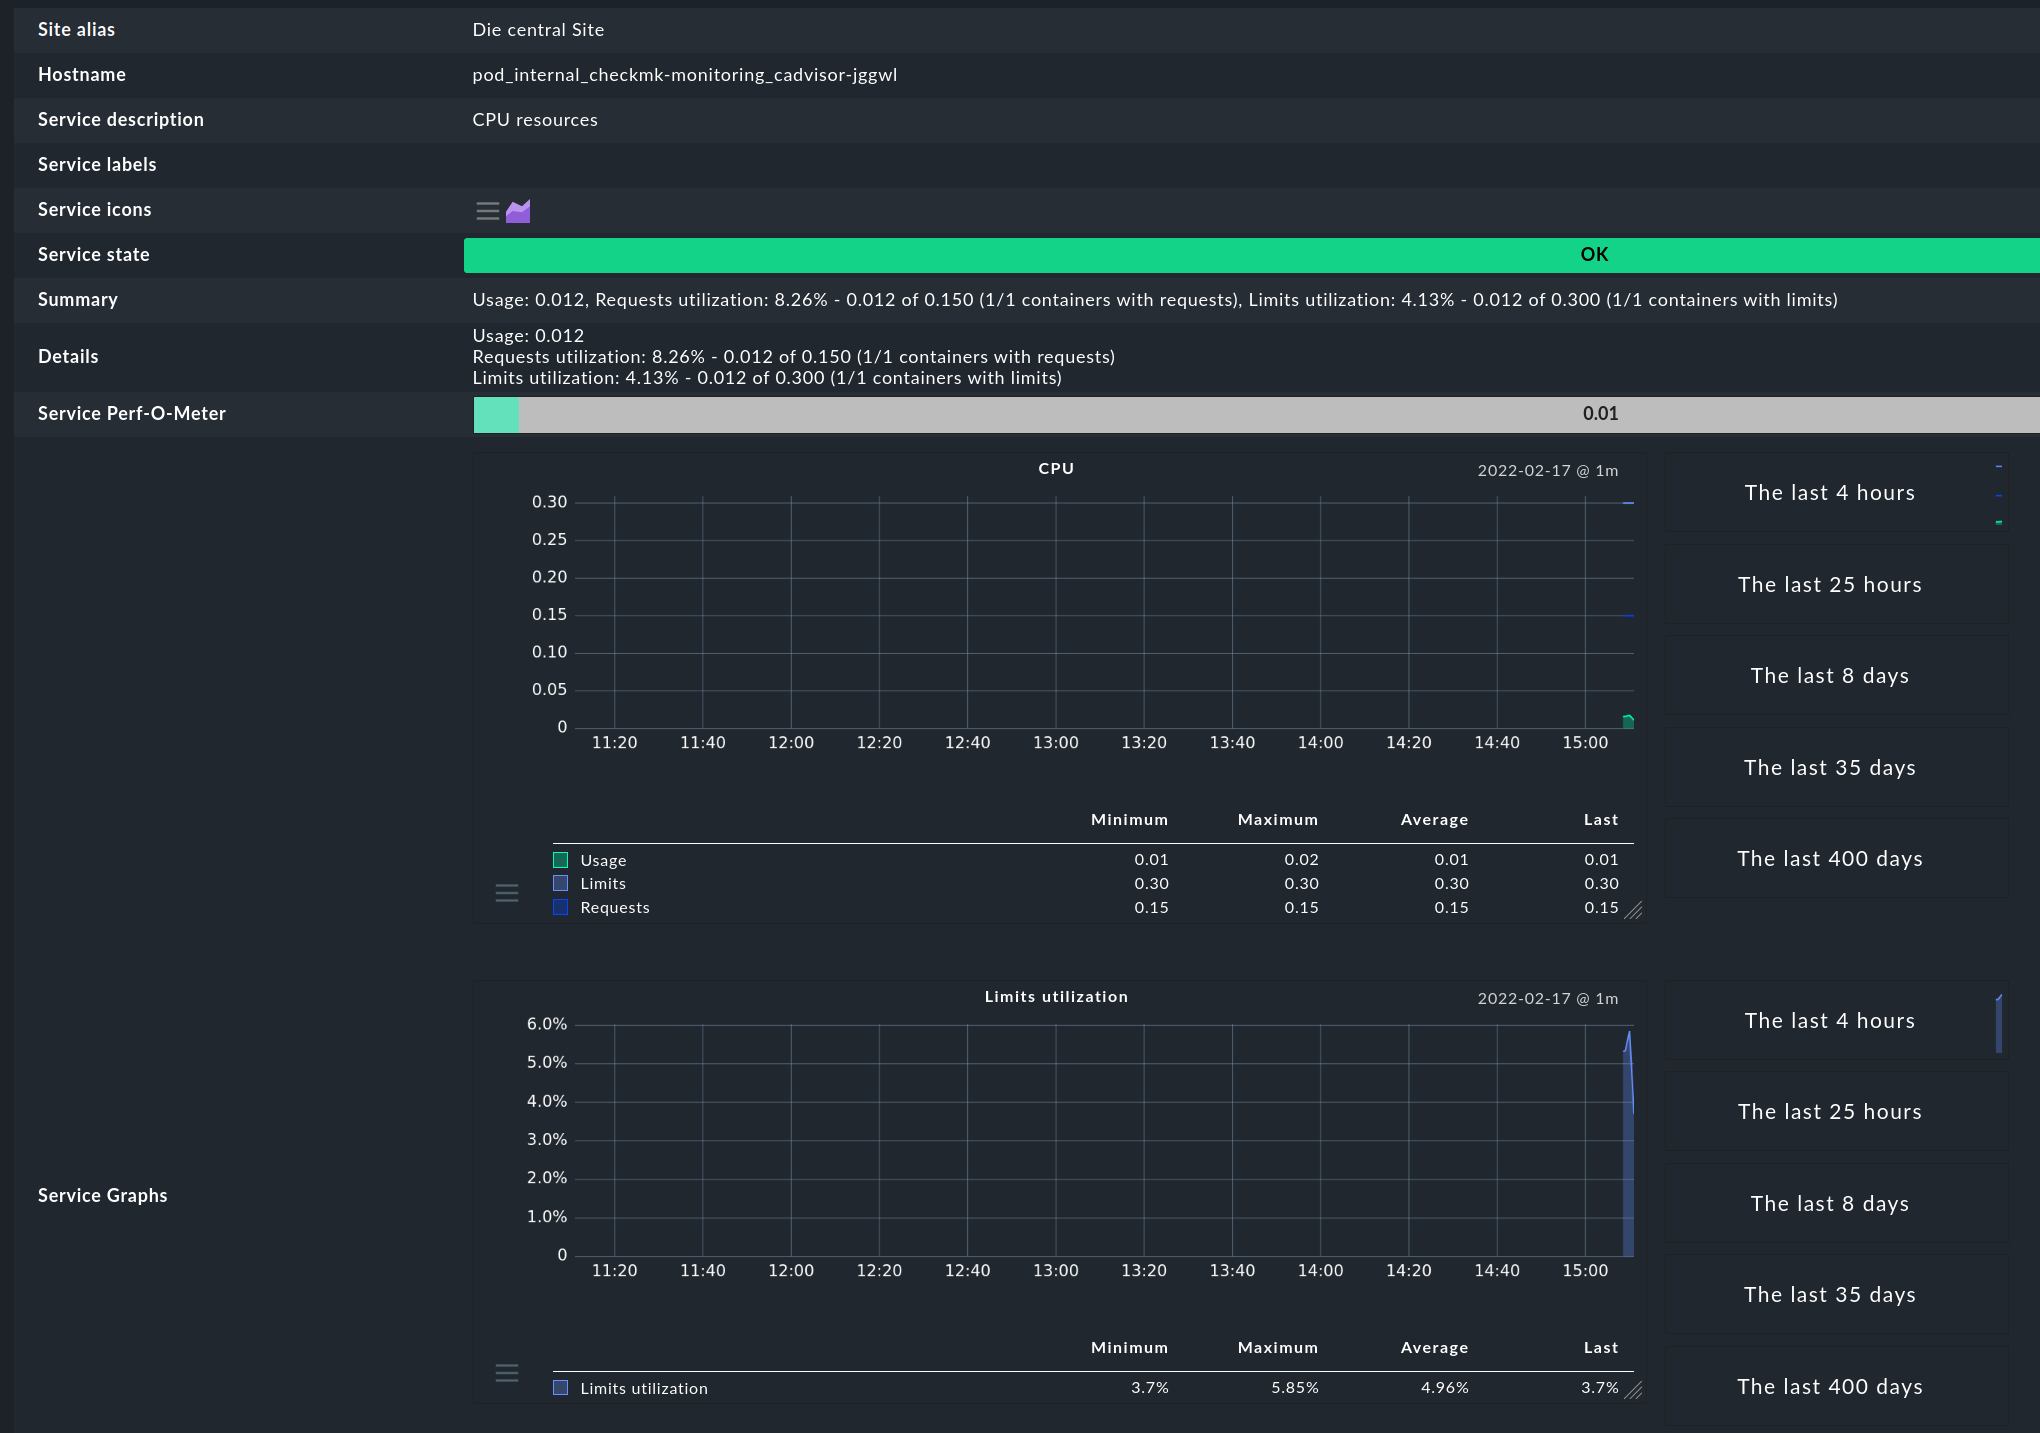
Ok, I understand these k8s_resources checks are supposed for another use case which I not yet fully understand like autoscaling.

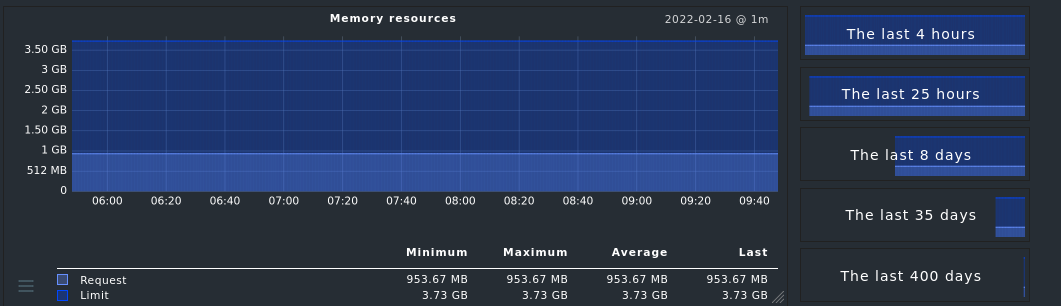
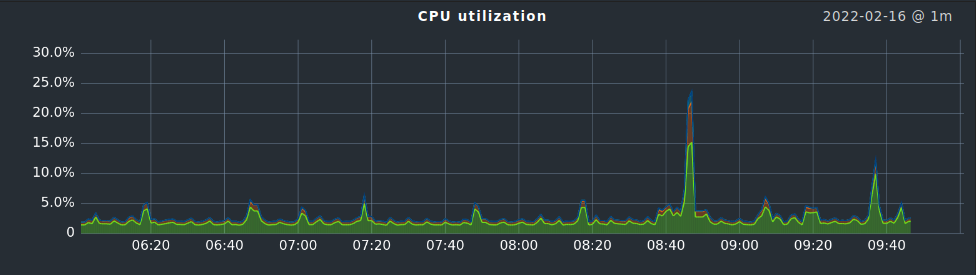
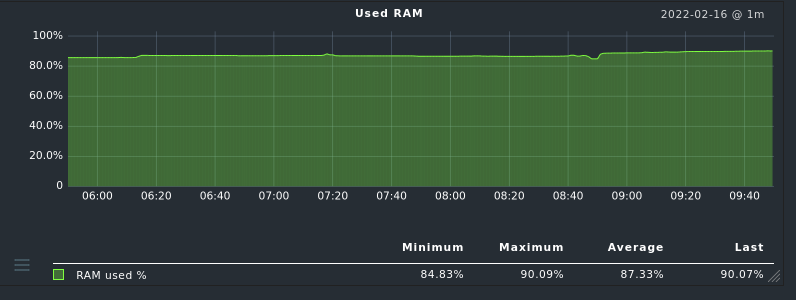
Our teams asks for pod CPU/RAM statistics and alerts.

So if I understand correctly, the k8s API has no information about CPU/RAM usage, right ?

Are there any other possibilities to get CPU/RAM usage over time as graphs per pod ?
I need CPU and RAM stats per pod.

Is Checkmk’s Prometheus integration supposed to fill the gap ?

We currently do not have Prometheus and not planning to introduce it
since we already have InfluxDB as timeseries-database.

Currently metrics from k8s are collected by a telegraf daemonset and written into InfluxDB.
I was told that the source of the metrics is the kubelet itself (this is the k8s software on each worker node).

This means to me that the k8s API perhaps does not know cpu/ram usage but the kubelet on each worker node does.

Having pod cpu/ram metrics is nice, but unfortunately
i need them in checkmk as well for alerting.

While digging through the Tribe29/checkmk git master branch, I saw a lot of changes related to kubernetes are comming with 2.1

  • k8s_ prefixed checks are going to be deprecated in 2.2
  • kube_ prefixed checks are going to be the next kubernetes checks in 2.1

I even fired up yesterdays master daily development build in a docker container (btw: thanks for that tribe29 team, that is so great that this is possible so easily!)

Looks like 2.1 will be able to monitoring pod restarts, we were waiting for that,
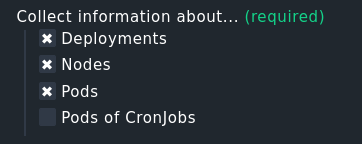
but looks like that [x] Services is now missing in 2.1 as possible “Collect information about …”

For us this a problem, we need the k8s services in monitoring to monitor
for port 443/80 and also doing HTTP health checks on the k8s services.

So 2.1 will not bring Solutions for us but another problem ;-(

Current 2.0.0p20.cee
Setup> Agents > VM, Cloud, Container > New rule: Kubernetes
image

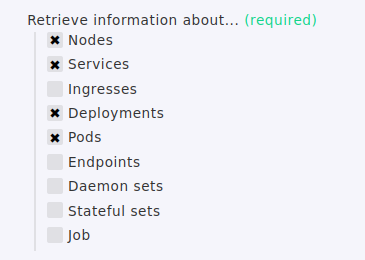
In 2.1 this is much less:

2022.02.17.cee (daily development build)
Setup> Agents > VM, Cloud, Container > New rule: Kubernetes
image

@martin.hirschvogel , I believe that you have got a very good overview about k8s moitoring and futur plans, are there any documents, hints how I will be able to monitor k8s pod cpu/ram and k8s services (kind: Service) in 2.1 ?

I am getting afraid, that we can not do k8s service monitoring and pod cpu/ram monitoring with 2.1 checkmk, please prove me wrong.

Thanks a lot
Mimimi

You use Prometheus exactly for this.

If you have replaced Prometheus with the telegraph/InfluDB setup, I think you have bad luck to integrate it easily with CMK.

For 2.1 i cannot say anything.

No worries, we are currently working on further checks. At the moment we are stabilizing the new Kubernetes agents, which also provides the required usage information on CPU and memory.

Next up in our list are statefulsets, daemonsets, namespaces, services.

Can you elaborate however a bit more on how you are using the information from services? We thought about actually creating a proper logic for monitoring the services (e.g. is the element behind it reachable).


I quickly started the monitoring, so that you can see how it will look like.
If you are interested in testing it, please send me a PM and I will send instructions around (as you need to deploy the Checkmk Kubernetes Collectors on your cluster).

Since the k8s service is the door to the outside world we made sure
that the monitoring hostname is translated to a real FQDN.

E.g. the hostname in monitoring for the k8s service is

myapp.dev.ops.k8s.company.tld

Now we can use for example check_http to check this url

https://myapp.dev.ops.k8s.company.tld/health

The app itself does return some json key value pairs in /health that reflect the health
of the app, e.g. if a databas connection exist, etc.

It’s true that this method is like monitoring a loadbalancer address instead
of the actual members behind it and it could happen that 9 out of 10 pods are dead,
and you wont notice because 1 pod is still delivering the service.
We discussed that a lot and the result was that we still only want to monitor the health checks on the service ip. The argument is: when pods are failing the orchestrator will fix it by starting new pods.

It gives you more the manager view on it : “Is my service running” (no matter if only running on 3 of 4 wheels). But this is what we want.

1 Like

This topic was automatically closed 365 days after the last reply. New replies are no longer allowed. Contact an admin if you think this should be re-opened.