Availability Report - query limit

CMK version: 2.4.0p15
OS version: RHEL 8.10

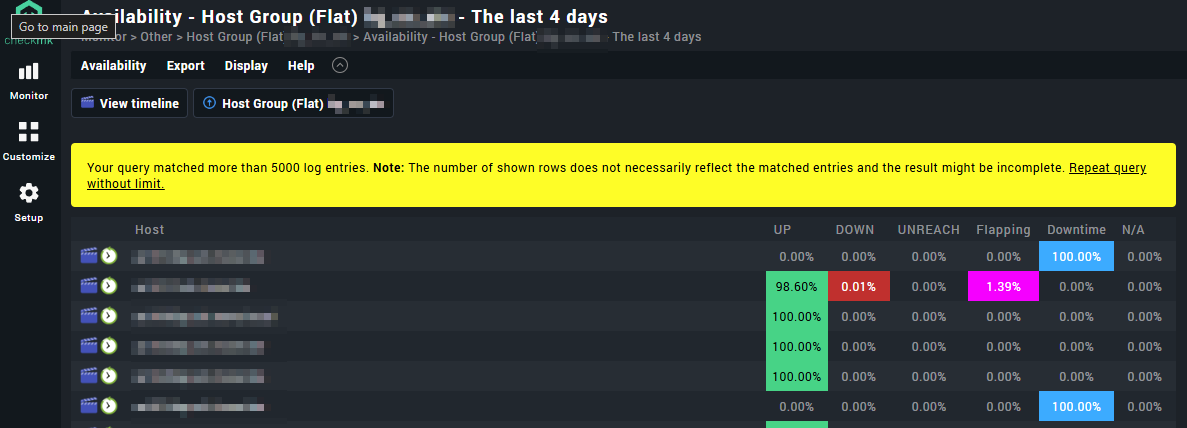
Error message: Your query matched more than 10000 log entries. The shown data does not necessarily reflect the matched entries and the result might be incomplete.

Hello everyone,
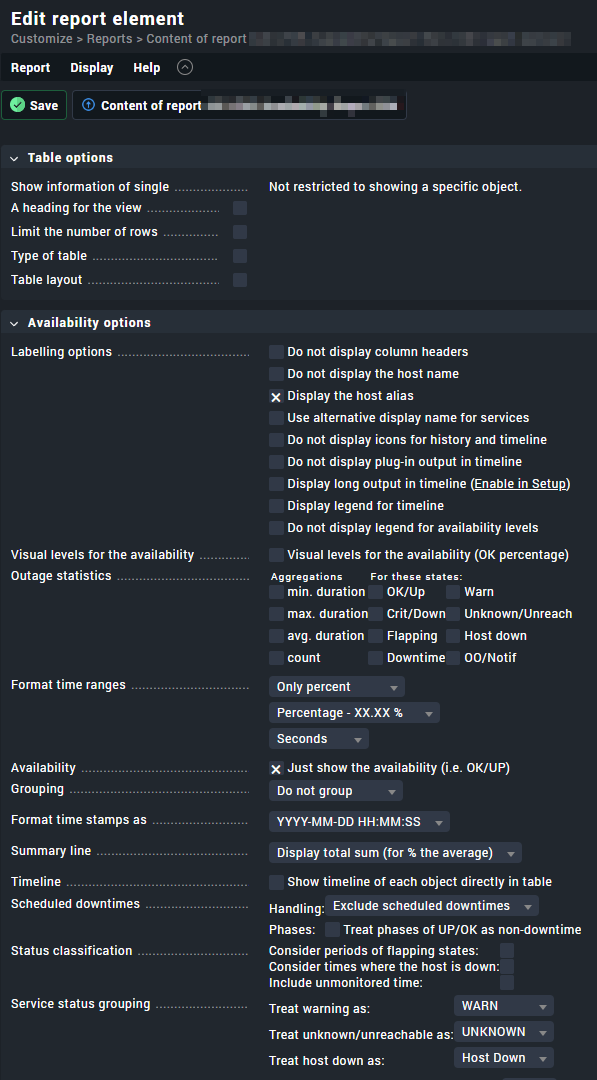
I actually wanted to set up my first SLA report in CheckMK today, as a colleague had asked for one. I went into it with a fairly positive attitude, as I thought CheckMK was capable of handling reporting. Unfortunately, I ran into a problem fairly quickly.

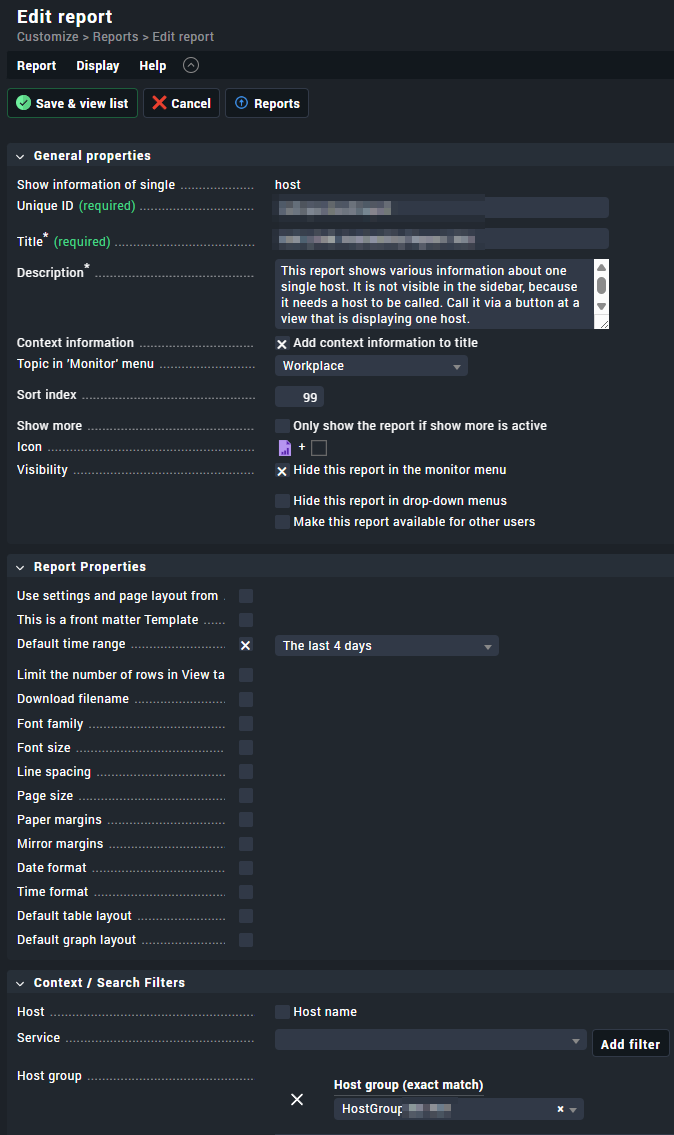
The issue is that I want to generate an availability report for around 120 servers. This report should run weekly, covering the previous week, and additionally once a month, covering the last 35 days.

At the moment, however, I can’t even manage to report on 4 days without a query problem. As soon as I select more than 2 days, I get the following error message: “Your query matched more than 10,000 log entries. The data shown does not necessarily reflect the matched
entries and the result might be incomplete.”

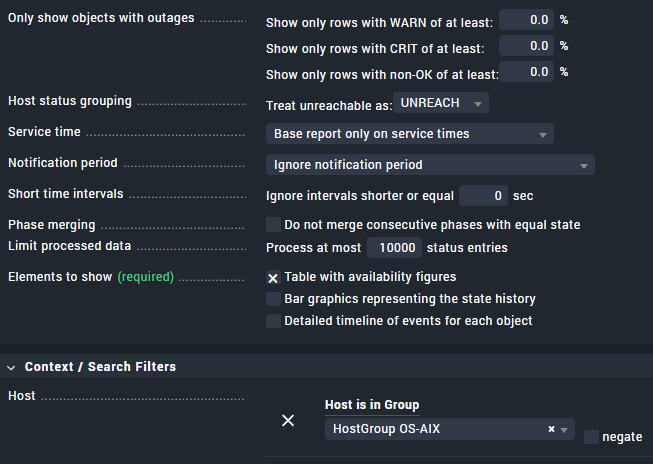
Initially, it said 5,000 log entries; I’ve already increased this to 10,000, without success.

Am I fundamentally doing something wrong, or is the reporting system only usable for fewer than 10 servers?

I don’t want to make any further critical comments about the basic usability of the reporting system at this stage…


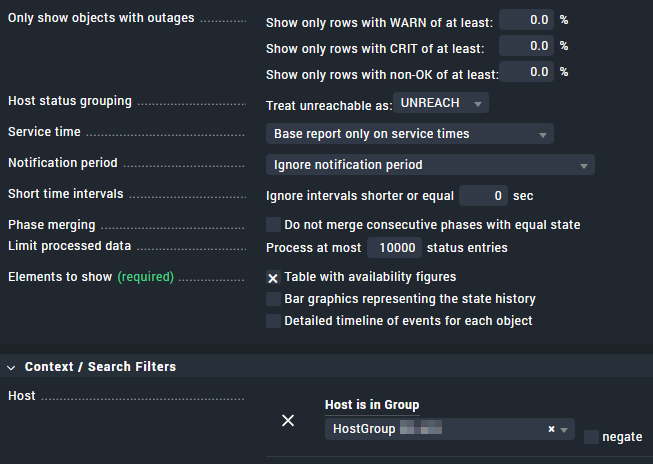
If 10,000 points aren’t enough for 120 systems over 4 days, what am I supposed to enter here? Why is it so complicated to get a simple availability report?

regards
Christian

1 Like

How many devices are you trying to retrieve? The availability report should contain the same amount number of hosts that you have in your environment. If you have additional pages with outages what you can do is use options like “Short time interval” which will reduce the report by removing short outages.

Hi Paulo,
I try to generate this report for a host-group containing 124 Systems.

I also get this warning, when viewing the availability directly in the ui:

1 Like

Also setting " Ignoring short interruptions" to 150 seconds does not lead to success. The warning is still there. :-/
I guess, that all these settings are used after the problematic query and do not have an impact here?!

1 Like

It seems that you have a problem with your filter. Which data is being shown (Availability of hosts in that host group or availability of all services inside hosts of that host group)?

Hi @CFriedrich ,

in your availability page you should reconfigure a setting:

Availability menu > change computation options > limit processed data > 0 (that deactivates the restriction)

Additionally:

  • You might need to change global setting “maximum livestatus response size“.
  • In a PDF report (I mean reporting, not availability) configuration the settings are available in the availability element and do not reflect wehat you’ve set in the availability page.

I hope this helps.

Best regards,

Marsellus W.

Hi Marsellus,
Thanks for your help so far.

I had already set the option you mentioned in the “Availability Content” report to 10,000. However, that wasn’t enough either. I learnt in one of checkmk’s training sessions that you should take the query warnings in checkmk seriously and, if possible, never increase the limit. That’s why I’m very reluctant to enter a 0 here in an enterprise environment. Is your recommendation safe to implement?

best regards
Christian

1 Like

If you have 124 systems you should see only 124 entries in your report. That part I was not able to understand.

1 Like