checkmk current version: 2.2.0p33
checkmk edition: Enterprise
Red Hat Enterprise Linux 8.7
Dear Team,
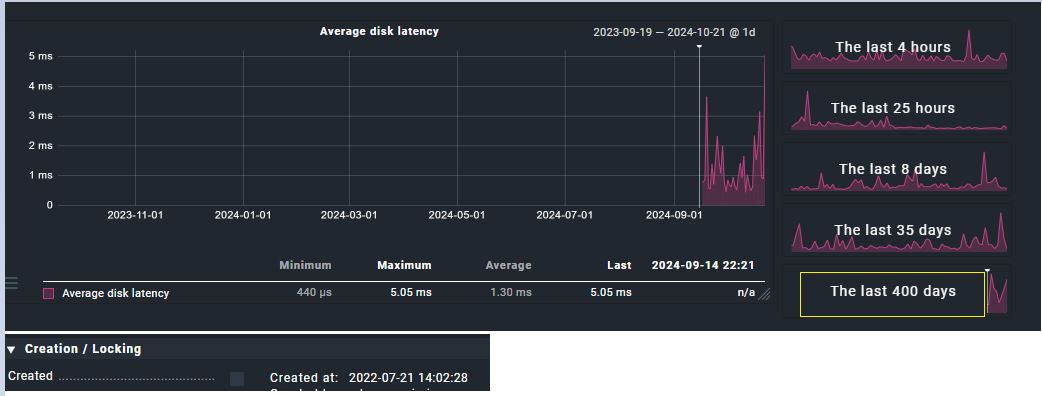
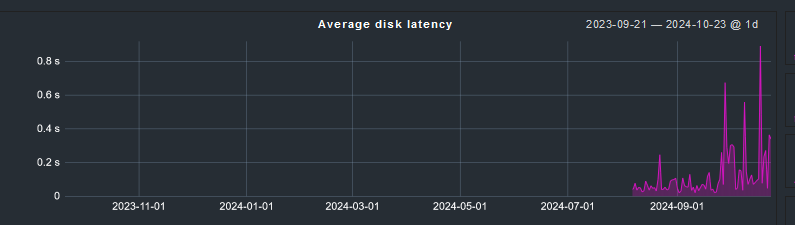
There seems to be missing data in the “Average disk latency” graph before a certain period of time. The graph is available from a particular time probably when the checkmk version was updated from v2.2.0p17 to v2.2.0p33.
Well the missing data is available on almost all cmk servers but not on the windows hosts.
Its hard to check on all windows hosts but I have checked on as much as i can.
Does this only affect a single metric, or all metrics of a service?
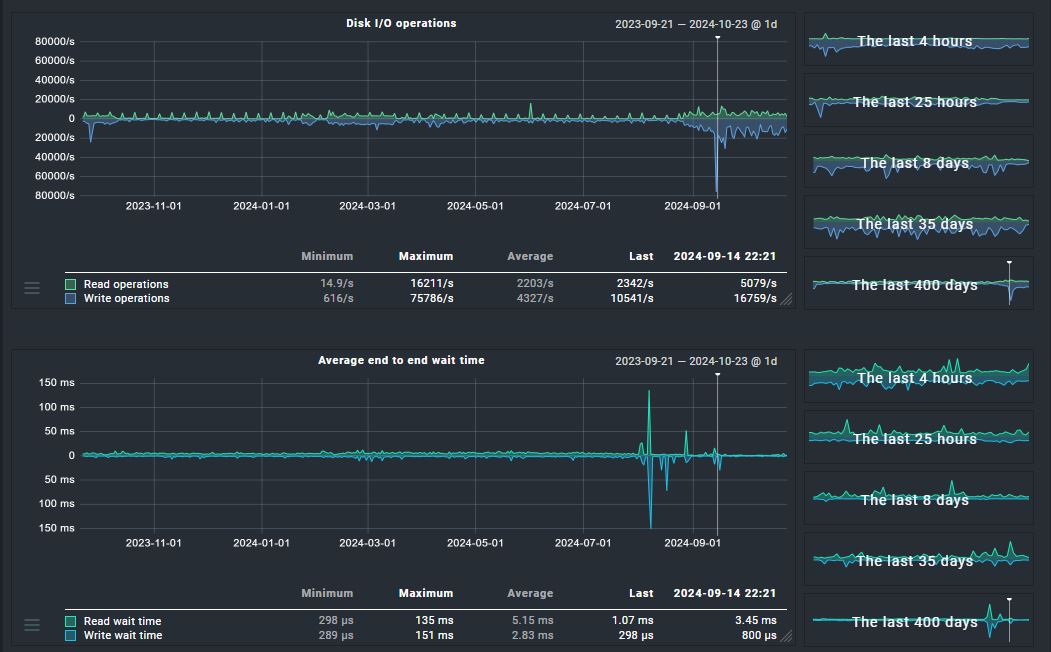
Did you check, if maybe another graph of the same service stopped recording metrics, when the one in the screenshot started?
This is affected only on “average disk latency” metric graph. Other metrics has the graph data.
As checked, another metric graphs of the same service has not stopped recording when the one in the screenshot started. It looks like probelm with only this metric.
We have this behavior ourselves with our Windows hosts. The graph starts from the day we updated the CheckMK. I assume that the check was updated and the graph was added there, so there is no previous data available.
Could be you are right.
If we assume that the check was updated and the graph was added there, then was this check already present in older checkmk versions and it got updated later or is this a complete new check?
Well, the “check” would be the service “Disk IO Summary” and it has been around forever. But sometimes new metrics are added to an existing service, or metrics are renamed.
Thanks for your inputs.
I would like to know if its possible to have the below check from this metric and if yes how can we achieve it.
Trigger: Average disk latency is 300ms or higher for 10 minutes.
You can go to the “Disk IO” service, choose “Parameters for this service” in the hamburger menu and then click on the ruleset name in the upper left. There you will find all possible configuration and thresholds for the service.
This topic was automatically closed 365 days after the last reply. New replies are no longer allowed. Contact an admin if you think this should be re-opened.