I have a server that I just built for the heck of it.
Ubuntu 18 LTS
This server is currently doing nothing, and I mean nothing.
It only has a single proc because it does nothing.
It has a 50 GB partition, thin provisioned on host with plenty of resources
It was setup the same way as a very busy host running Ubuntu 14 LTS
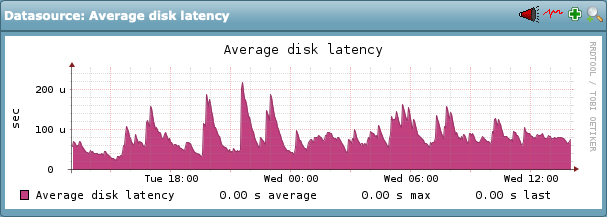
Check_MK version runs from the Ubuntu 14 server (CRE 1.5.0p21) and I’m trying to monitor the Ubuntu 18 server. Everything looks perfect, with the exception of IOPS. The disk latency is constantly at 100 ms and really, every single disk statistic looks really bad. Way worse than the busy server running Check_MK as a site for the entire org.
So locally, do you guys have any tips for checking your work that’s pretty decent? Tips for iostat, or atop or other?
I’m trying to figure out how a server doing nothing has performance that looks this bad via Check_MK and I need to know if it’s really reporting it accurately.
The servers are setup with the same SCSI controller via the host so I just wanted to see if you guys had any tips for checking things out.
I was hoping to have some sort of tool that would match what Check_MK shows for the real awful values but I’m not sure if there’s anything that will give the output in the same or similar values.
Hi,
just my 2 cents: Nowadays every OS is optimized to do multi processing. How about trying a second core and see if this has an effect.
Thanks for the suggestion!
I added it this morning at 6:00 but it didn’t make a dent.
I also did a nproc command to ensure the second proc showed up and Check_MK also reports it’s fine. It’s just really weird. I can look at the vmware datastore metrics for this host as well but it shows the latency is basically nil. Like, maybe it spikes to 12 ms but averages are 0-1 ms.
The stats on this server look better than the Check_MK server and what the Check_MK server reports for this host.
I just haven’t seen behavior like this before and I’m considering…is Check_MK wrong? Do I rebuild the guest? Just a weird situation for me. I’ve build the VM’s before, I have them running on different hardware, better hardware, worse hardware (far worse) and they all perform better than this host doing nothing whatsoever.
Hi,
look again at the metric you took from VMware. The spikes are 10000ms(!) - don’t miss the k next to 10 on the left side.
Hence it’s not a checkmk issue.
I wonder: What is the base under DELLSAN-SATA? Single SATA drives? How many VMs on them?
Aw man, I totally missed that. I got some guests showing 1 ms for the high spikes and this one is outta control!
I’ll have to have the server guys open an incident with vmware. The SAN itself shows latency at a high is usually around 10 ms for the SAS disks.
Looks like we have 23 VM’s on that storage.
4xSSD and 6xSAS
Really, the SAN shows no issues that I can find. VMware on the other hand…shows huge spikes in performance so that’s where I’ll have to tell them to target.
Thanks for catching that @gulaschcowboy
Maybe another catch. You gave metrics for “DELLSAN-SATA”. Why is it called SATA if SSD/SAS is underneath?
I’ll have to ask the guys that set it up 
I appreciate that feedback though! 
It’s split into different disk groups to do different things. I’m not sure whether or not any of them are used for caching. I know on some SANs you add in faster SSDs for caching the initial data before the final destination, but I’m not at all familiar with the recommendations when they were setting this up. I’m a networking guy more than a server guy.
Below are all the disks and the groups.
So the groups are A:Performance, B:Performance and A:Archive
The disk groups are below:

Those just coincide with the above graphic to show which disks belong to which groups. But pretty much every single server we’re hosting here is on the disk group A:Archive
But when you check out latency for the group, or the disks, they’re all 20 ms or under.
Here’s A:Archive from 12-23 to 12-26

So on the SAN itself, the metrics look better than the spikes vmware show with 10,000 ms latency.
All of the disk groups show acceptable, and the SSD is faster because it’s not utilized much at all.
Edit: We also do have a separate DELLSAN-SSD area that encompasses at least 2 of those SSD drives, based on the storage being reported by vmware. So the final 2 are either used for caching, or they’re just named something else on the storage connections in vmware that isn’t obvious to me 
Ok, no solution but just an update. Server team has done an incident with vmware on this and they say based on their logs it’s a SAN firmware problem. They will be installing and then revisiting the issues with latency.
I’ll post back when I know more.
So, sorry for the late response, but to add some closure here…
We had 2 issues:
- ATS locking seemed to not be setup properly on the SAN that was configured. We apparently required NIC driver and firmware updates to have this all work as expected.
- There were failover paths on the networking side that were not configured correctly either
There’s more to point 2, in that each server has 2 NICs and 1 goes to 1 switch and 1 goes to another switch for multiple failover options. I think there’s more to configure via VMware and the switches we were plugging in to to get this working properly.
But once the SAN was configured properly, things improved and Check_MK showed it. Though I’ll say when we removed the redundant connections and switch, everything started moving blazing fast with latency that’s definitely acceptable.
Thanks again for the help!