Hi, I have a problem that I can’t solve.
I need to create dashboards on Grafana for viewing Checkmk source data. I use Chechmk Raw Edition version 2.2.0p9 and the grafana plugin 3.1.1. I have loaded all my hosts on checkmk, I don’t use the agent but I just ping the public IP of my clients’ router to monitor the up/down status of their connection, and on checkmk it works very well, while on grafana it doesn’t. I can view the data but I get the error: Bad Request The requested graph does not exist
I have correctly inserted and configured the Checkmk data source, when I go to create the view I can select the checkmk sites, then the hosts to monitor (I find the list of all my checkmk hosts), as a service I only find the ping entry and I select it, I set single metric but any option to follow I always get the same error and I don’t see any data.
I’ve tried everything but I can’t figure it out.
Can anyone help me? I would be truly grateful, I’ve been stuck in this error for months.
Hi @mosa
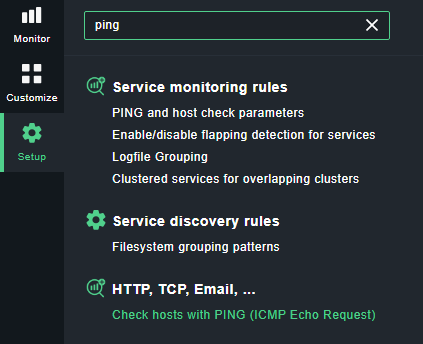
I don’t know if you’re using cee or cre, but I think you need to create an extra service check in order to get the metrics for your desired ping check.
If you need help creating the ping as a service check, let us know.
Hi, I’m using the latest version of the raw edition, and yes, I would really appreciate your help. I don’t know where to start to create what you indicated to me, the destination hosts are routers, most of which do not have snmp so I only use the ping service to obtain the up/down status of the connection. I would like to report these data on grafana by creating a summary graph. It would be better if you could also call up the host groups on grafana in this way
ok, following your suggestion I managed to get the ping metrics for the hosts, but now I have another problem. I need to create graphs but for different types of hosts and on grafana I don’t have the possibility to choose the host groups but only the monitoring sites, how can I solve this?
so: you use checkmk raw, but you want to create a dashboard showing graphs from all hosts of a hostgroup?
this is a checkmk enterprise feature, as only enterprise editions implement the more complex filter logic for graphing.
but there might be a workaround: you can create a variable in your dashboard, and you should be able to create a filter for host group there (this uses the livestatus filtering mechanism, also available in checkmk raw). then you enable “multi-value” for this variable, and the repeat option in the panel options. then you could at least have one panel for each host. as far as i know it’s not possible to repeat the graph inside a single panel.
This topic was automatically closed 365 days after the last reply. New replies are no longer allowed. Contact an admin if you think this should be re-opened.