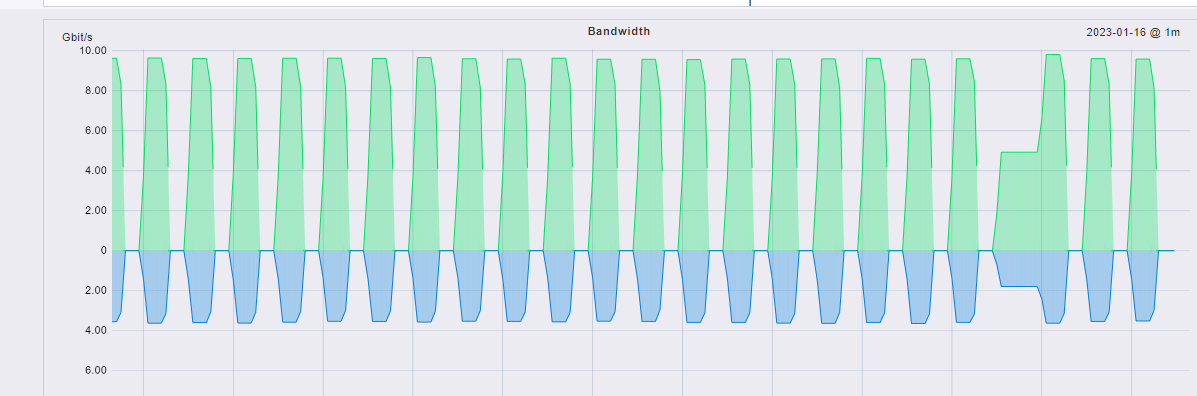
Error message: Bandwidth graphs shows uncorrect bandwidth for switch interfaces. For example, 9 Gbit/s where i know the real usage is around 5 Gbit/s. Bandwidth reported is almost double. Already tried with if64 and 32 bit interface check.
Output of “cmk --debug -vvn hostname”:
Checkmk version 2.1.0p12
Try license usage history update.
Trying to acquire lock on /omd/sites/ip_tv/var/check_mk/license_usage/next_run
Got lock on /omd/sites/ip_tv/var/check_mk/license_usage/next_run
Trying to acquire lock on /omd/sites/ip_tv/var/check_mk/license_usage/history.json
Got lock on /omd/sites/ip_tv/var/check_mk/license_usage/history.json
Next run time has not been reached yet. Abort.
Releasing lock on /omd/sites/ip_tv/var/check_mk/license_usage/history.json
Released lock on /omd/sites/ip_tv/var/check_mk/license_usage/history.json
Releasing lock on /omd/sites/ip_tv/var/check_mk/license_usage/next_run
Released lock on /omd/sites/ip_tv/var/check_mk/license_usage/next_run
Switch are queried with a longer interval (5 minutes). Unfortunately i cannot find any RRD rule in my Checkmk installation. Where should look in the Raw edition?
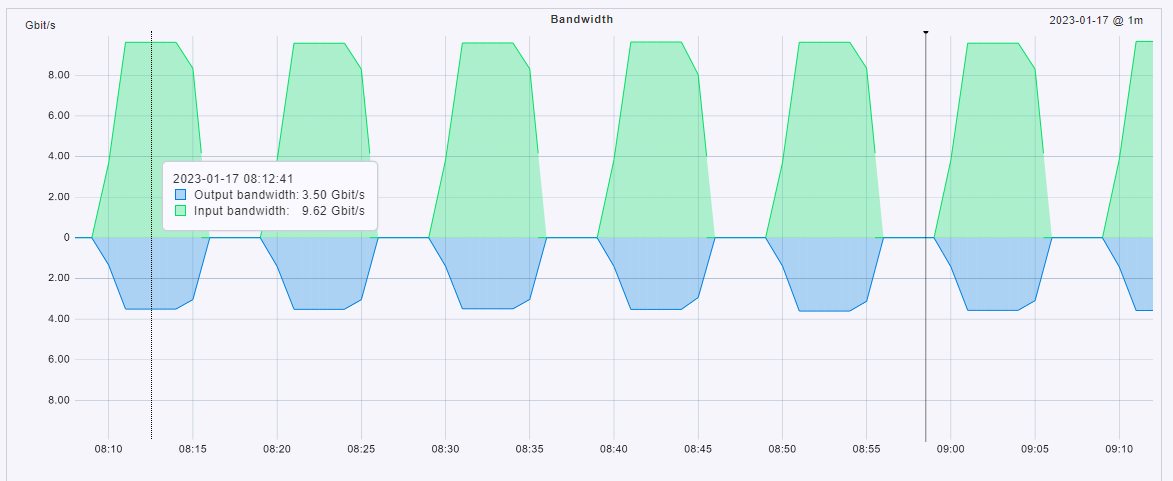
How do you defined the 5 minute check interval. Inside the graph you have every minute a data point.
Or better said can you post the graph that the X axis is visible and only for 1 or 2 hours.
As you can see from the screenshot, distance between the checks is exactly 5 minutes. Then the value is flat (no updates) for some minutes. I am not sure why the graph is not completely vertical. Any suggestion/consideration is welcome
Your 5 minute check interval is configured the wrong way. That’s why i want to know how you have done it.
If you have a real 5 minute interval the graph would only show 1 point every 5 minutes. Your graph has every minute a data point.
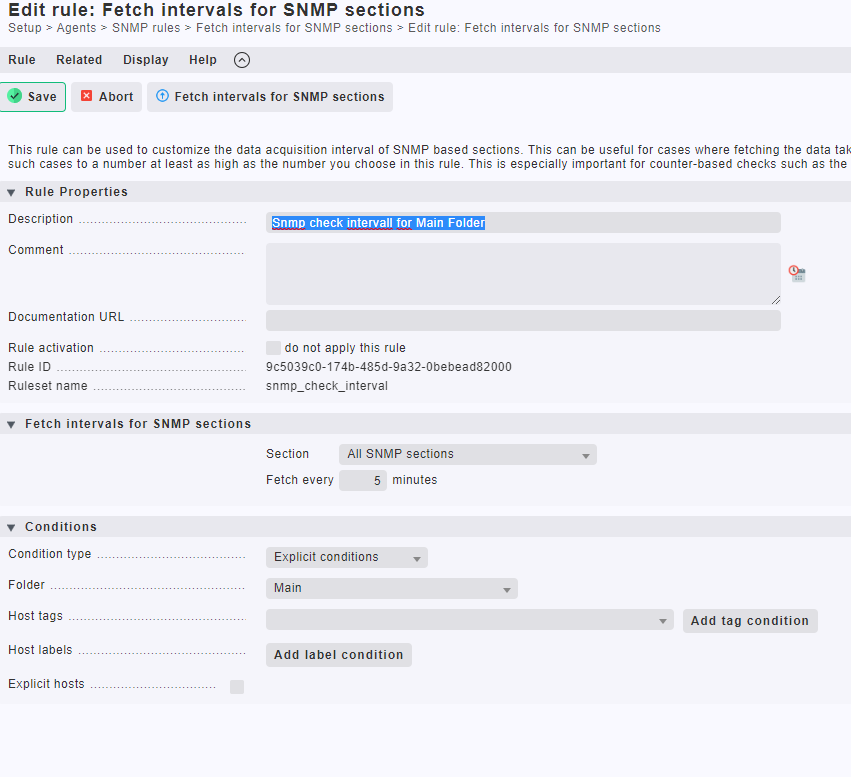
I see the problem. This rule should only be used if you want some section not fetched the normal interval (1min) and it should not be used for checks that work with counters.
In your case, if you want all checks on the host only be done every 5 minutes, the rule “Normal check interval for service checks” would be the right one. Here you should specify the host where you want to 5 minute interval and pay attention that this rules stays below all the other rules. You don’t want the HW/SW inventory or any other long interval check to run with your 5 minute setting.
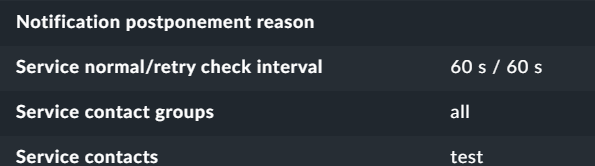
To cross check this you can have a look at the detail page of one of your services.
This is the default setting and your system should show the same. After you created the “Normal check interval” rule this should be different then.
This topic was automatically closed 365 days after the last reply. New replies are no longer allowed. Contact an admin if you think this should be re-opened.