Bandwidth perf-o-meters not showing percentage after upgrade

Hello Community,

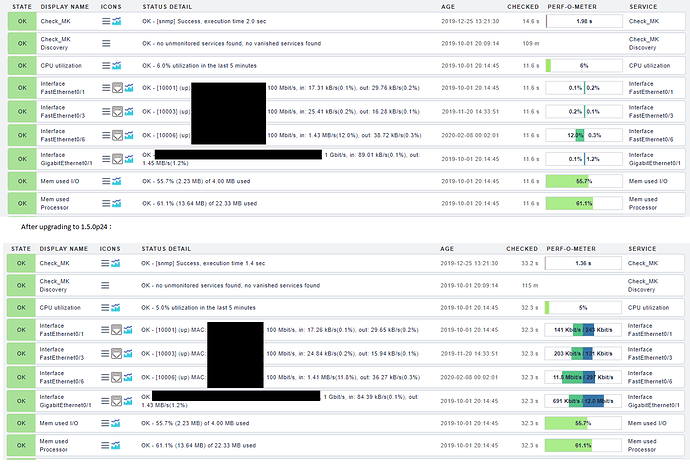
after upgrading check_mk from 1.5.0p13 to 1.5.0p24 the bandwidth perfometers are not showing the relative percentage anymore. Instead they are showing the bandwidth in bits/s.

I tried configuring this in the service parameters but does not find anything.

Can someone please give me a hint, what was happening while updating.

Thanks in advance
Marco

Hi there and welcome to the forums!

Are we talking about the default bandwith check_mk plugins or is this a custom plugin?

Hi Daniel,

thanks for your answer.
I did not change any plugin, I think. It’s some months ago I configured check_mk for the first time.
But I think its the default plugin for Cisco Switches that was used via SNMP check.

Best regards
Marco

Can you some information how does it look at the moment? (small screenshot)
Also important is the information what you get in the service output and the performance data.

Hello Andreas,

thanks for your answer. Here are the Screenshots:

Both screenshots are the same switch, before and after the upgrade.
Seems the default Per-O-Meter Unit changed somewhere beetween p13 and p24, but I neither find something in the changelogs nor how to change it in the parameters-section of the services.

Thanks in advance
Best regards
Marco

You are right there was a change between these versions.
If i look at the old code and the new one i cannot see why it is not working now without further investigation.

Old Code

def perfometer_bandwidth(in_traffic, out_traffic, in_bw, out_bw, unit = "B"):
    txt = []
    have_bw = True
    h = '<table><tr>'
    traffic_multiplier = unit == "B" and 1 or 8
    for name, bytes, bw, color in [
          ("in",  in_traffic,  in_bw,  "#0e6"),
          ("out", out_traffic, out_bw, "#2af") ]:
        if bw > 0.0:
            rrate = bytes / bw
        else:
            have_bw = False
            break
        drate = max(0.02, rrate ** 0.5 ** 0.5)
        rperc = 100 * rrate
        dperc = 100 * drate
        a = perfometer_td(dperc / 2, color)
        b = perfometer_td(50 - dperc/2, "#fff")
        if name == "in":
            h += b + a # white left, color right
        else:
            h += a + b # color right, white left
        txt.append("%.1f%%" % rperc)
    if have_bw:
        h += '</tr></table>'
        return " &nbsp; ".join(txt), h

    # make logarithmic perf-o-meter
    MB = 1000000.0
    text = "%s/s&nbsp;&nbsp;&nbsp;%s/s" % (
        number_human_readable(in_traffic * traffic_multiplier, 1, unit), number_human_readable(out_traffic * traffic_multiplier, 1, unit))

    return text, perfometer_logarithmic_dual(
                 in_traffic, "#0e6", out_traffic, "#2af", 1000000, 5)

def perfometer_check_mk_if(row, check_command, perf_data):
    unit =  "Bit/s" in row["service_plugin_output"] and "Bit" or "B"
    return perfometer_bandwidth(
        in_traffic  = savefloat(perf_data[0][1]),
        out_traffic = savefloat(perf_data[5][1]),
        in_bw     = savefloat(perf_data[0][6]),
        out_bw    = savefloat(perf_data[5][6]),
        unit      = unit
    )
New Code

def perfometer_bandwidth(in_traffic, out_traffic, in_bw, out_bw, unit = "B"):
    traffic_multiplier = 1 if (unit == "B") else 8

    # if we do not have bandwith make logarithmic perf-o-meter
    if in_bw <= 0.0 or out_bw <= 0.0:
        MB = 1000000.0
        readable_in = number_human_readable(in_traffic * traffic_multiplier, 1, unit)
        readable_out = number_human_readable(out_traffic * traffic_multiplier, 1, unit)
        text = "%s/s&nbsp;&nbsp;&nbsp;%s/s" % (readable_in, readable_out)
        return text, perfometer_logarithmic_dual(in_traffic, "#0e6", out_traffic, "#2af", MB, 5)
    # if we have bandwidth
    else:
        txt, data = [], []
        for name, bytes, bw, color in [("in",  in_traffic,  in_bw,  "#0e6"),
                                       ("out", out_traffic, out_bw, "#2af")]:
            rrate = bytes / bw
            drate = max(0.02, rrate ** 0.5 ** 0.5)
            rperc = 100 * rrate
            dperc = 100 * drate
            a = (dperc/2, color)
            b = (50 - dperc/2, "#fff")

            txt.append("%.1f%%" % rperc)
            if name == "in":
                data.extend([b, a]) # white left, color right
            else:
                data.extend([a, b]) # color right, white left
        return " &nbsp; ".join(txt), render_perfometer(data)


def perfometer_check_mk_if(row, check_command, perf_data):
    unit = "Bit" if  "Bit/s" in row["service_plugin_output"] else "B"
    return perfometer_bandwidth(
        in_traffic  = savefloat(perf_data[0][1]),
        out_traffic = savefloat(perf_data[5][1]),
        in_bw     = savefloat(perf_data[0][6]),
        out_bw    = savefloat(perf_data[5][6]),
        unit      = unit
    )

Thank you very much for the info!
Thats interresting.

I also compared the code at my server, but I didn’t find any changes from p13 to p24.
Can you tell me the path to the perf-o-meter config file you postet, it’seems I checked them at an other directory.

I checked them at /opt/omd/versions/1.5.0p13.cre/share/check_mk/web/plugins/perfometer/check_mk.py and
/opt/omd/versions/1.5.0p24.cre/share/check_mk/web/plugins/perfometer/check_mk.py

Thanks in advance
best regards
Marco

I took a look at the code and the problem code comes from another file :slight_smile:
All perf-o-meters are normally now defined inside the file ~/share/check_mk/web/plugins/metrics/check_mk.py
The perf-o-meter defined there for interfaces don’t know anything about the bandwidth. The old definition posted above had this knowledge. The changed file posted by myself was between 1.5.0p1 and p24 i think.

Inside the metrics/check_mk.py file you can search for “if_in_bps” to find the locations of the definition.
I also found the commit 10674 FIX Interface bandwith: Add missing perf-O-meter for in/out mea… · tribe29/checkmk@7509d1f · GitHub from last month. It added the missing & “wrong” perf-o-meter for all checks with Bits/second. The Bytes/second where already in the wrong format before.

Hello Andreas,

thanks a lot for your research!!

I’m not sure if I got you right.
I checked the lines in my metric file: /opt/omd/versions/1.5.0p24.cre/share/check_mk/web/plugins/metrics/check_mk.py

They are exact matching the green lines in the commit you linked to.

What I did not undestand is your last sentence, do I have to change something in that file altought there are the same as in the commit?

Sorry for my inability :wink:

Best regards
Henry

btw. I meanwhile also tried jumping to 1.6.0p8 with exactly the same result, so maybe it is a wanted change in design and not a bug?

If you comment out theses lines from the linked commit, all your checks with “bits/s” as unit should show the old perf-o-meter.

This is not a “recommended” solution only a workaround to get back the percents.

Hello Andreas,

thank you very much, now it looks like before!

I’ll try upgrading to 1.6 and try if it is working, too.
Thanks to virtual machine teqnique I can use a VM-snapshot, since downgrading back from 1.6 to 1.5 is not supportet, I learned from my last try @ version 1.6 :wink:

Thanks again and all the best for you
Best regards
Marco