Unfortunately I am hitting a roadblock here, despite many hours of searching and reading. Although I found this excellent guide for setup ( https://www.youtube.com/watch?v=RHJpDpK2ACE ) there are few guides on how to set up actual monitoring and notification.
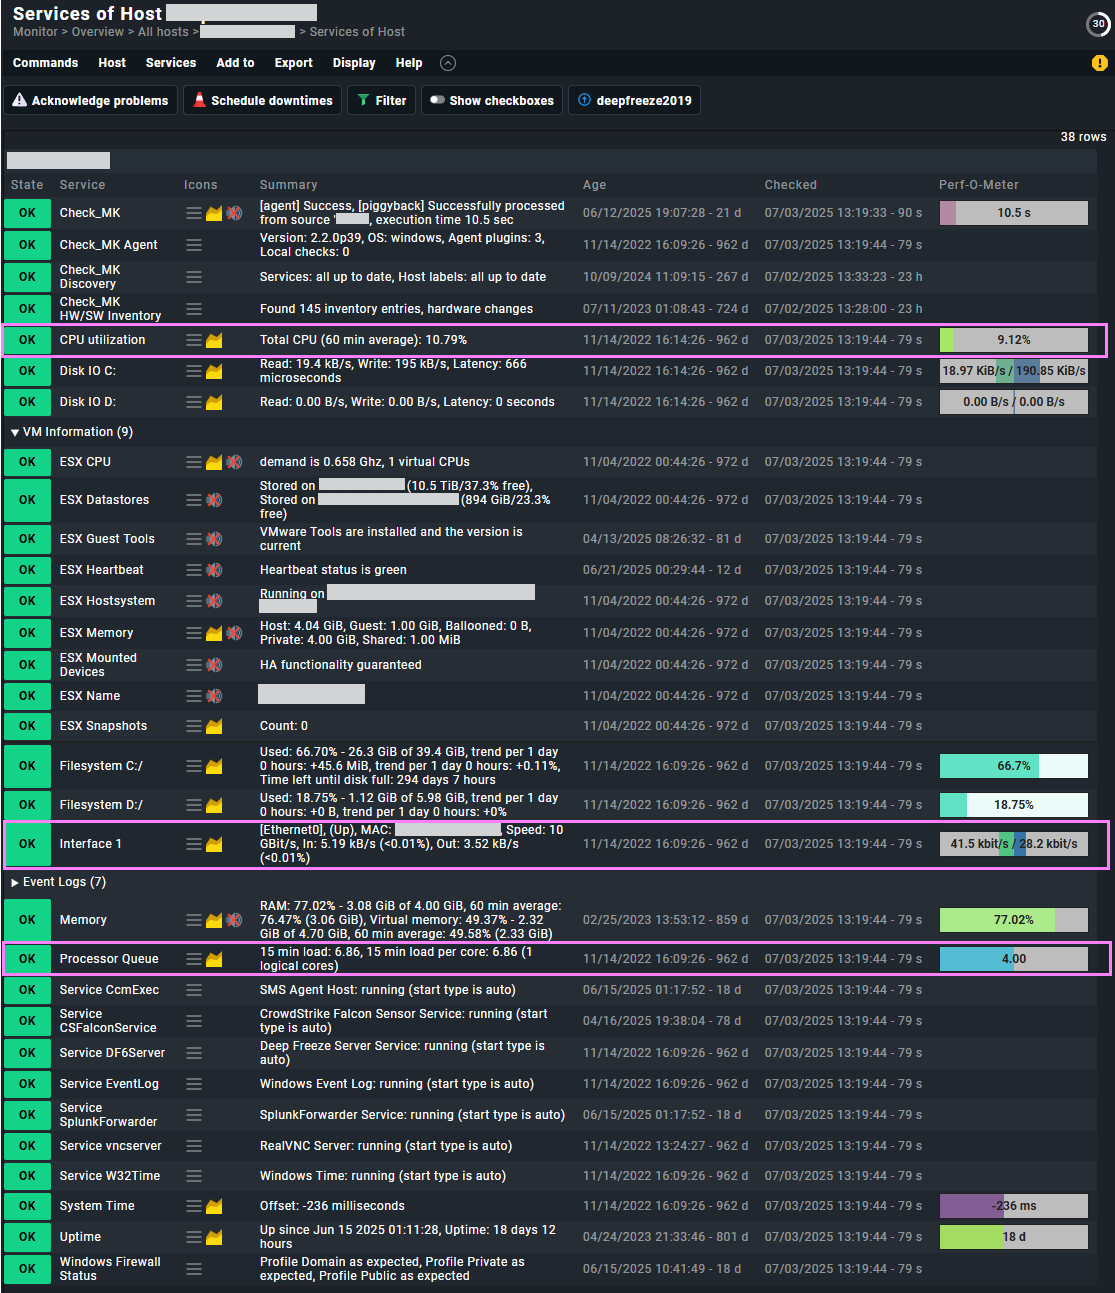
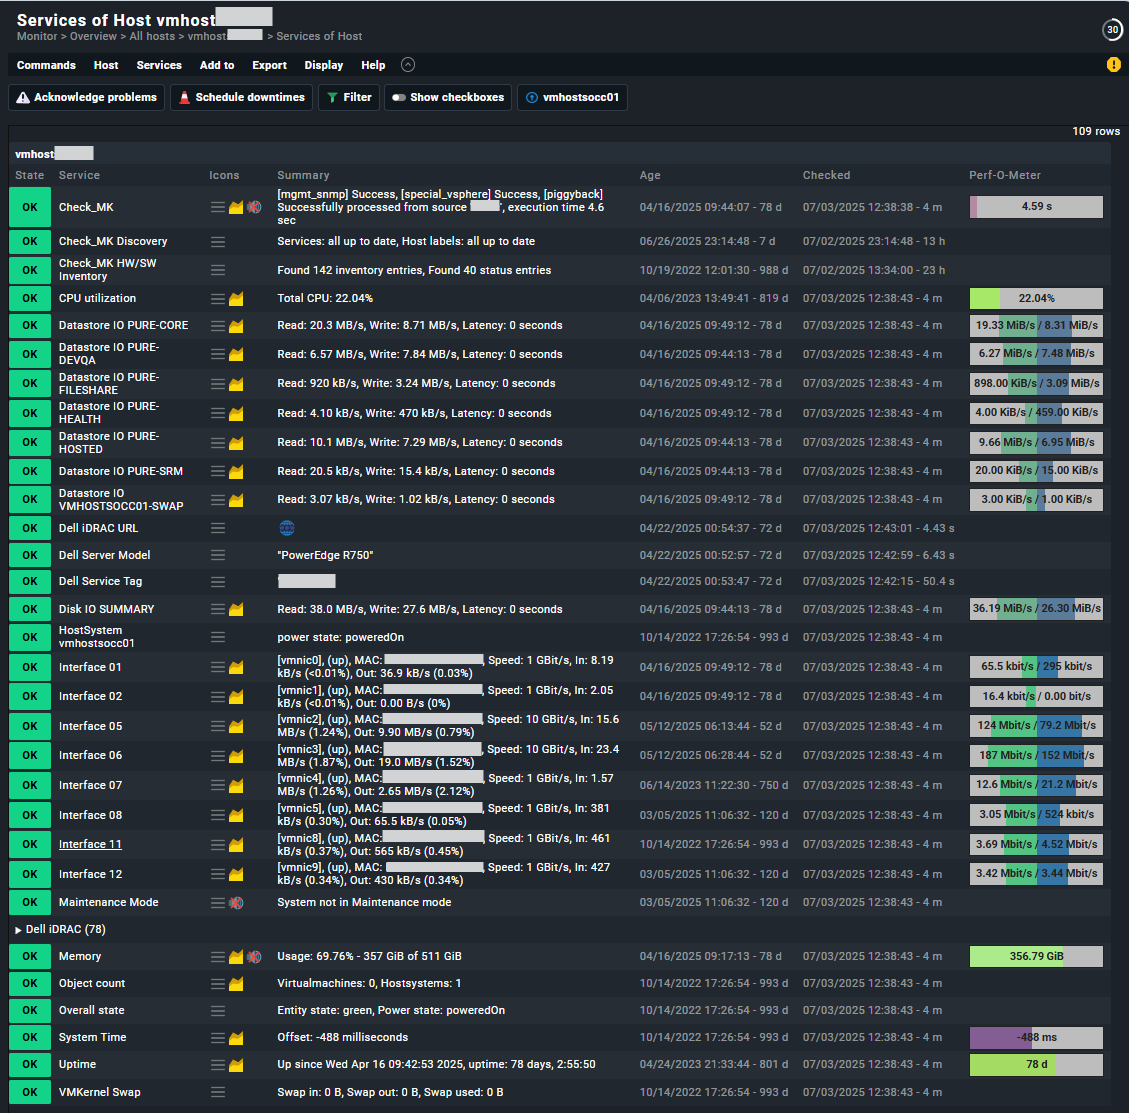
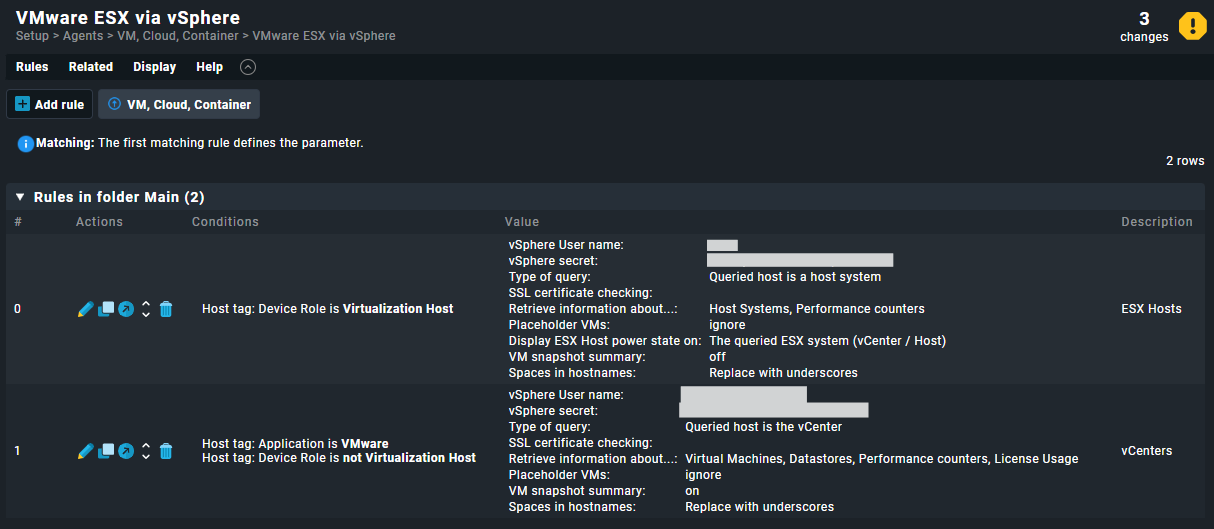
In the detected services of an ESXi server I am expecting to see e.g. “CPU utilization”, “Memory”, and several network interfaces, but they are not present. I see filesystems, but excluding filesystems and VMs I only see 6 services: Check_MK, Check_MK Discovery, ESX Snapshots Summary, HostSystem, Object count, System Time. All examples show many more than this! Why might this be?
When I look at the dashboard at Monitor => Applications => vSphere VMs, the CPU utilization and ESX Memory columns are blank. Why is this? Is it because those services don’t exist in my list above?
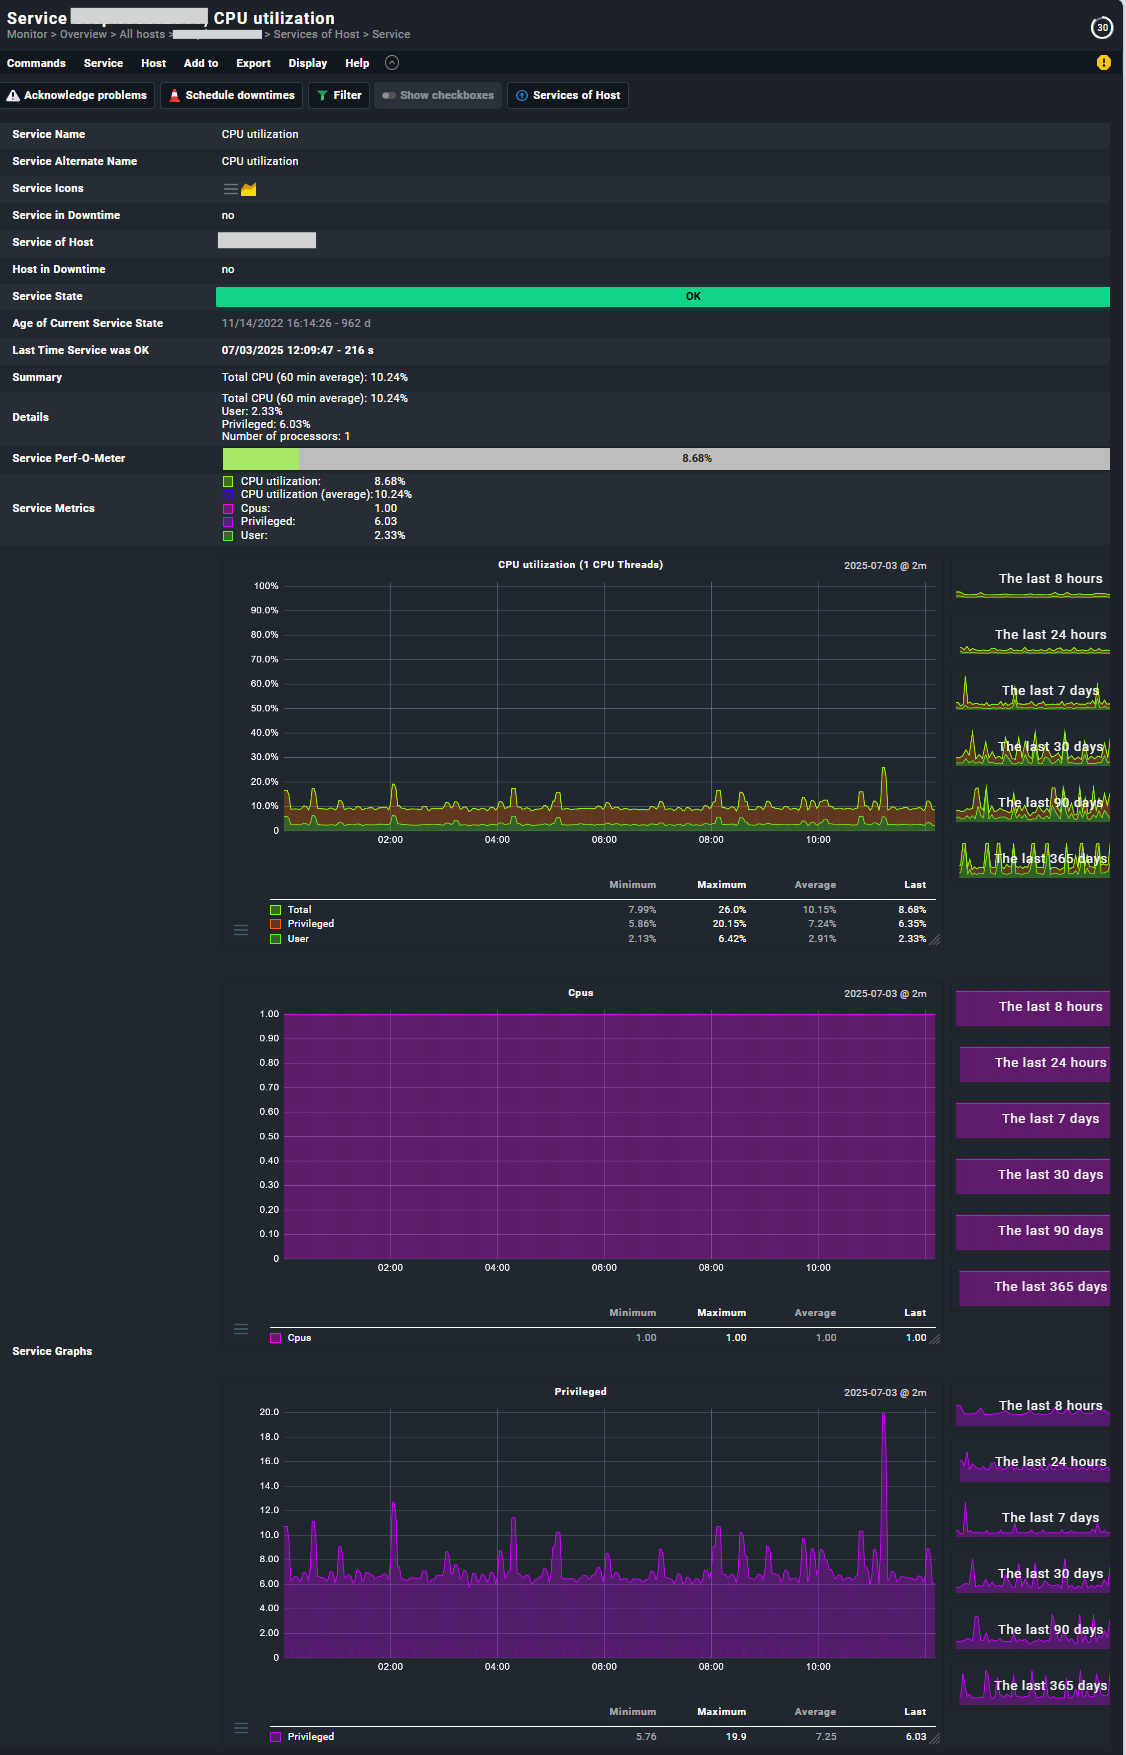
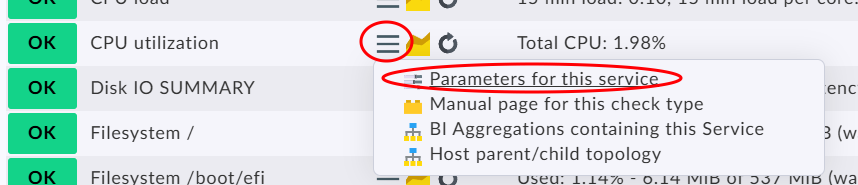
On the VMs I get the following list of services: Check_MK, Check_MK Discovery, ESX CPU, ESX Datastores, ESX Guest Tools, ESX Heartbeat, ESX Hostsystem, ESX Memory, ESX Mounted Devices, ESX Name, ESX Snapshots, Object count, VM . This seems a decent list, and both ESX CPU and ESX Memory contain performance data I can hover over in the service screen. I’d like to display them better though.
I followed the guide here ( Building a dashboard for vSphere monitoring in Checkmk ) to create a new view with “CPU” and “Memory” of the ESXi host, but those extra added columns are also always blank. I do the same for the VMs view - also blank; looking in the VM service list I see they are called “ESX CPU” and “ESX Memory”, but setting to that is blank in the VMs view also  Why?
Why?
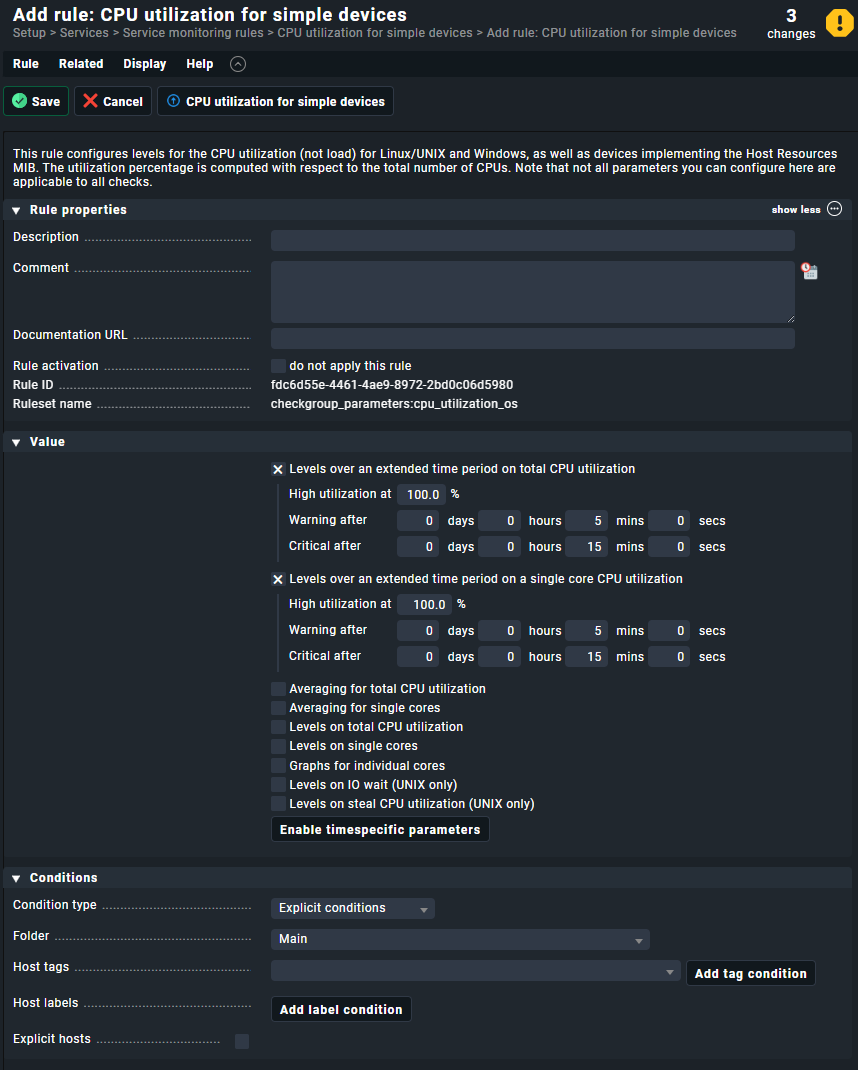
I am beginning to think that checkmk is just not detecting the expected data. The servers are Dell PowerEdge R640 and 630 running ESXi 7.0.3 so they should be good. The guide says “dashboarding is also part of the Checkmk Raw Edition (CRE), but some features like certain dashboard elements are only included in the CEE” - are performance details only in the CEE? Surely not?
I am suspecting that this is why my notifications are not working - because the underlying metrics don’t actually exist.
Unfortunately I am running out of time to get checkmk running now, having spent 3 days on this. I will shortly have to abandon and move to another monitoring software…