Hi All, I have resources (mostly NFS and CIFS shares) mounted across sets of monitored hosts.
The CIFS shares in particular seems to trigger CheckMK (“server not responding”) issue detection and notifications regularly. The applications on the hosts are not that sensitive to the transient CIFS issues so I didn’t even have any idea of this until I implemented CheckMK. I suspect it maybe a network issue causing the CIFS timeouts. Since many of these same exact shares are mounted on 10s of hosts, I then get flooded with notifications.
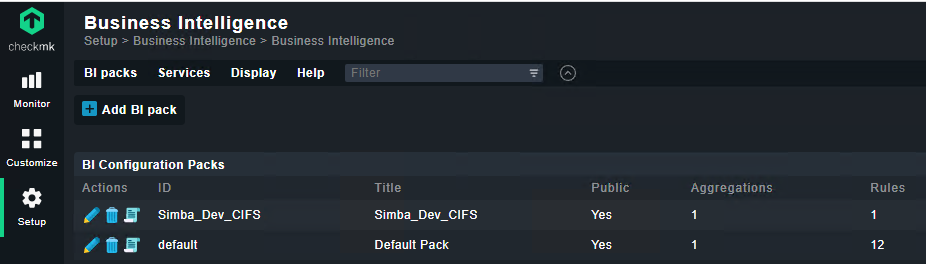
I decided to look into “BI aggregation” using most of the default settings explained in the doc Business Intelligence (BI) - Reduce complexity with BI
I have 2x issues:
I was expecting only one entry in the main dashboard when there is an issue on any of the aggregated services but instead I get one entry per service just as when I used regular service configuration. In addition, all the entries are now set to the state of the aggregation (I am using the “worst - take worst of all node states” aggregation function option so I understand why, but it is confusing if actually only one service has an issue, but now I have 20x services listed in the main dashboard with the state of the aggregation.
I was also expecting one notification per aggregation, but instead I get as many notifications as there are aggregated services which defeats the whole purpose of implementing the BI aggregation to reduce the number of notifications I am receiving.
Let me know if I have misconfigured it somehow and any way to optimize the configuration to meet my two goals i.e., (1) one entry on main dashboard for an aggregation if an issue occurs, and (2) one notification sent if one to any or all services in the aggregation encounters an issue.
Thank you.
I would suggest:
disable notifications (or even set them into downtime if you don’t want them in the main dashboard) for all the direct CIFS mount services, then assign the Service (or services if you split aggregations by mount point) monitoring your aggregation(s) to the host that provides the share. (Make sure to select that the aggregation does not follow downtimes)
This way only the services monitoring the aggregated states will be able to generate alerts and hence notifications.
If I misunderstood your issue, maybe share some screenshots for clarification.
Thanks for the quick response. I already disabled notifications for the individual services. In fact, the interesting thing I noticed is that the underlying service was actually replaced by the aggregate service when you list the services under each host included in the aggregation.
Maybe a bit more info. Let’s say I have a CIFS share mounted on /apps on 20x hosts. I create a BI aggregation for this share/service. If any of the aggregated services has an issue (e.g., goes into warning state), I then see 20x entries in the main dashboard (one for the aggregate service on each server) set to the state of that single service that had the issue. In addition I receive 20x notifications - one for per server for the aggregation (note, not the underlying service).
would you mind sharing a screenshot of the dashboard/list of services + your rule for showing the BI as a service?
Based on your description, I feel like there is a misconfiguration/misunderstanding somewhere, but it’ll be hard to pinpoint without seeing exactly what you’re seeing.
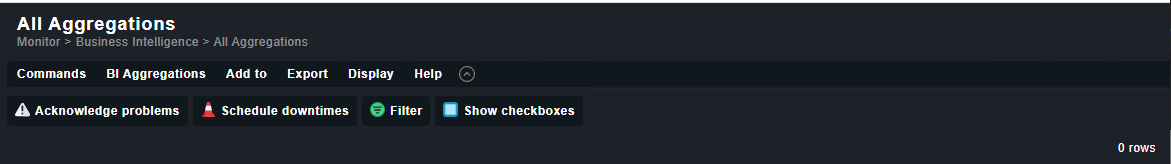
ok, but that is a new problem within the BI. If you BI doesn’t show up within the “All Aggregations” page, then you have to fix that first.
Maybe make it less flexibel at first and hard-code some values then replace them with variable input one by one to catch the error.
Thanks. I managed to fix the display issue. Now I have the aggregation under Monitoring.
I can use the “Fake check results” on one of the aggregated services and only that one appears in the main dashboard.
But I have two issues now.
When setting up the aggregated services. Let’s say I have the same /apps CIFS share mounted on 20x hosts and each hosts has a name like somename.dev.lse.edu. Currently I added 20x “state of service” node generators. I can’t seem to figure out a regex that CheckMK won’t complain about that allows me to use just one child node generator.
The most important issue is that I am trying to setup notifications. Not sure which option to choose in the “Setup > Agents > Other integrations > BI Aggregation”. I tried not selecting anything under the “Filter aggregations” or “Aggregation assignment” and when I test again with the “Fake check results” again on just one aggregated service, I then get an entry for every service in the aggregation on the main dashboard with the state I set the single service to. So without setting up the notification it works as I want, but I need to setup the notification so I can notify contacts. Thank you.
possible share screenshots of two hosts with their cifs service. That would remove some speculation on our part :).
Usually just “.*” for the Host and the CIFS service name in the service should work
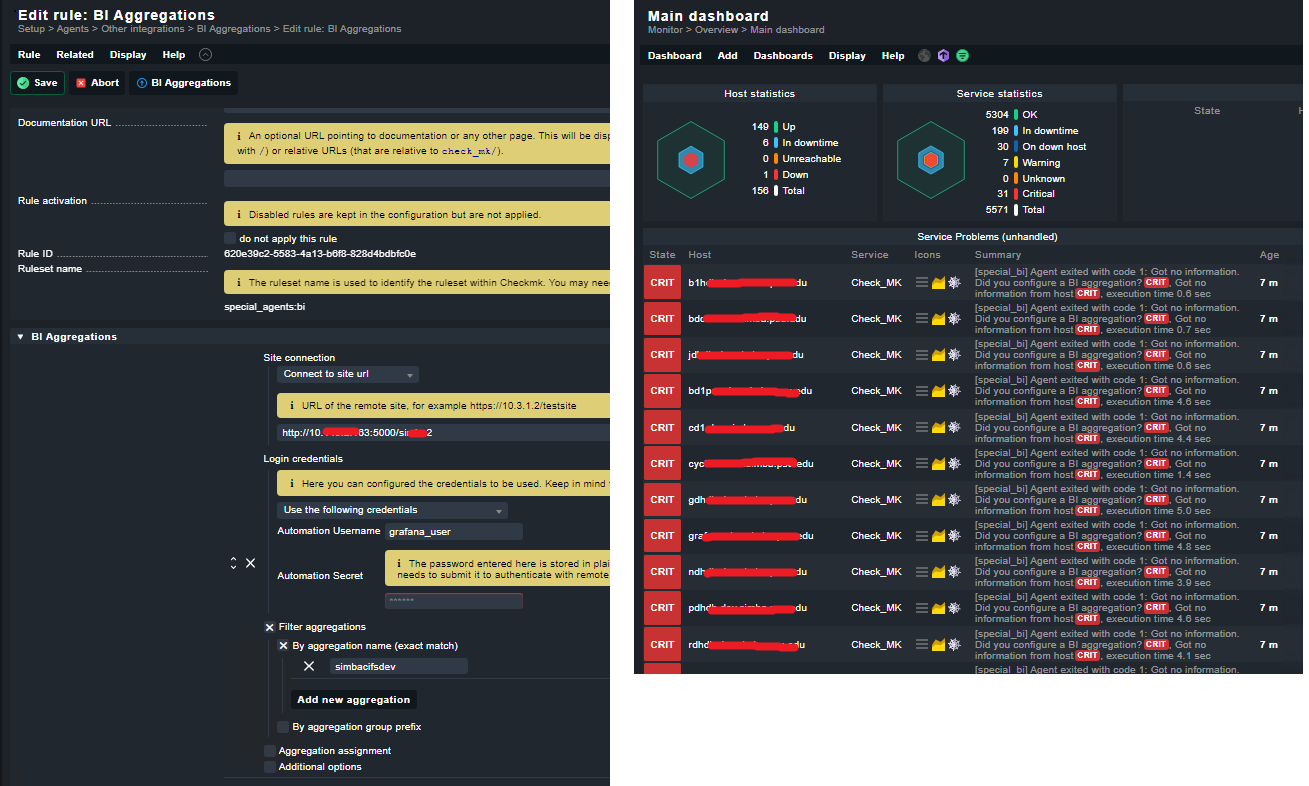
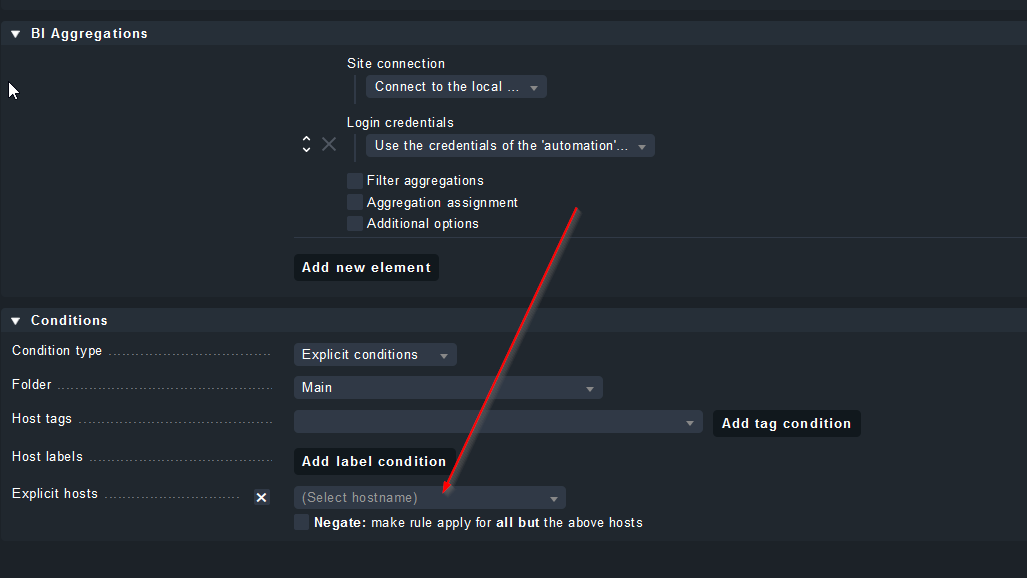
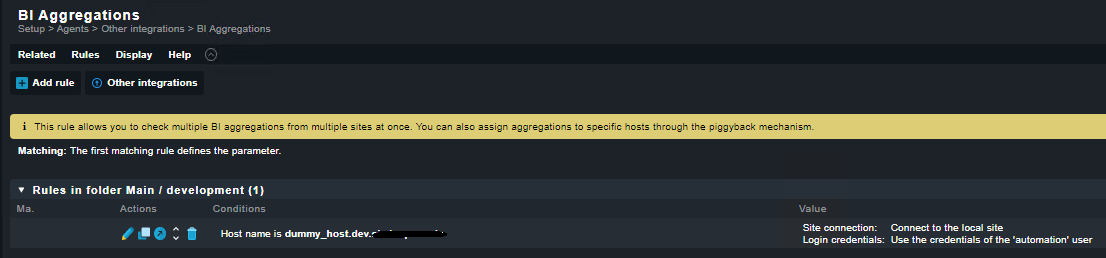
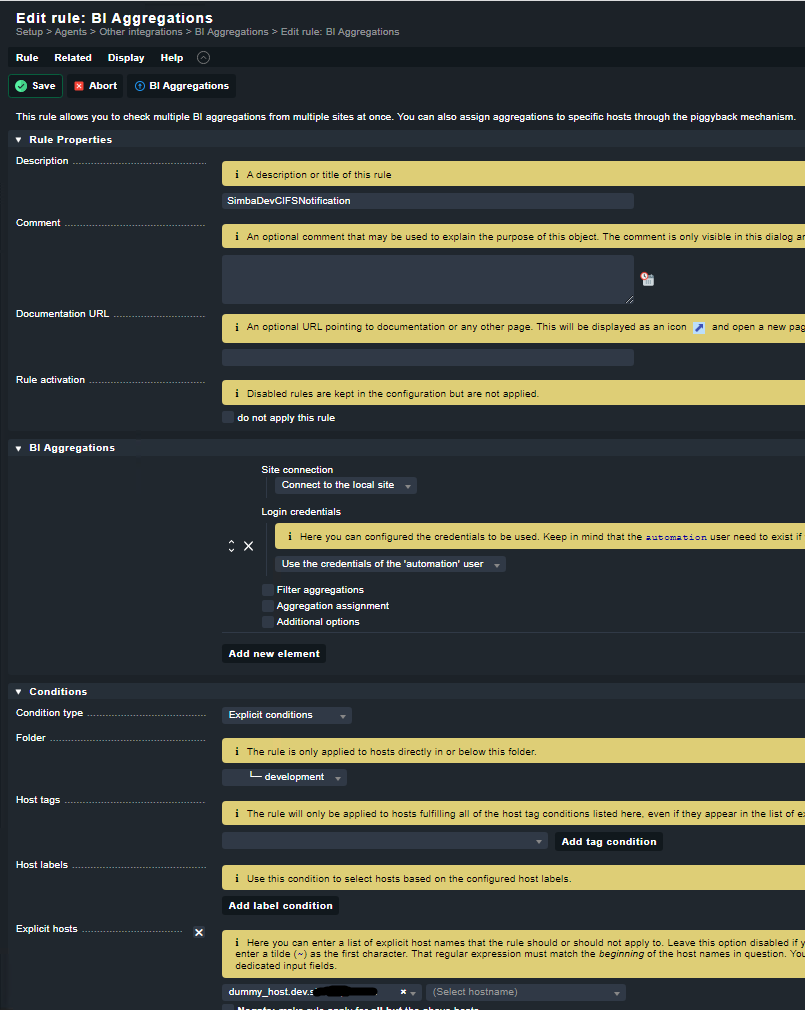
can you share your “Other Integrations > BI Aggregation” Rule in a screenshot and the view in the dashboard that you feel is wrong? In the “BI Aggregation” Rule, what hosts do you have set in the “Conditions” section of the rule?
also: did you disable notifications or even set downtimes for the original “CIFS…” service? Otherwise, just adding it to a BI Aggregation, does not mean that it won’t show up in the dashboard itself or create notifications.
Thank you. If you use * for the host regex, how do I limit it to match all hosts in a specific folder for example?
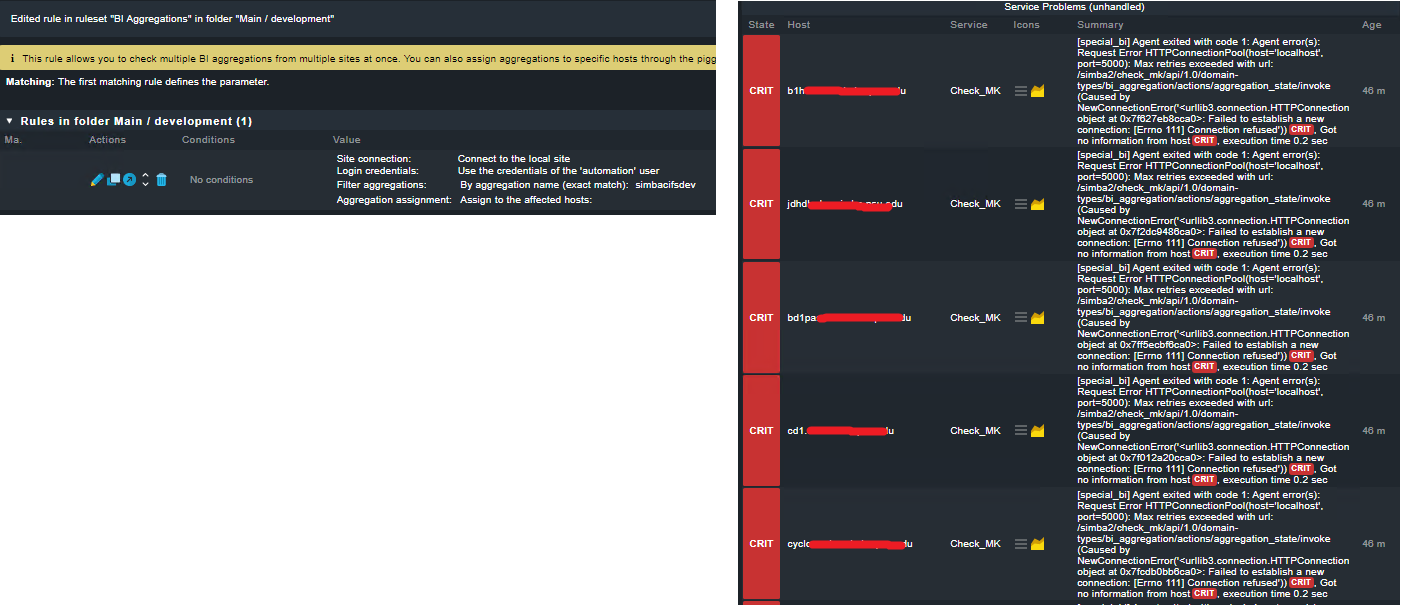
General: I have disabled notifications for all aggregated services. I also set downtime on just one service for testing purposes. I have tried a specific user account and the "use the credentials of the ‘automation’ user’ as the “Login credentials”. I used the “Connect to the local site” for all tests (though the first test below also shows me using the specific URL/port of the CheckMK server).
Test 1. Aggregation assignment: empty/not-selected. See screenshots bi001.pig
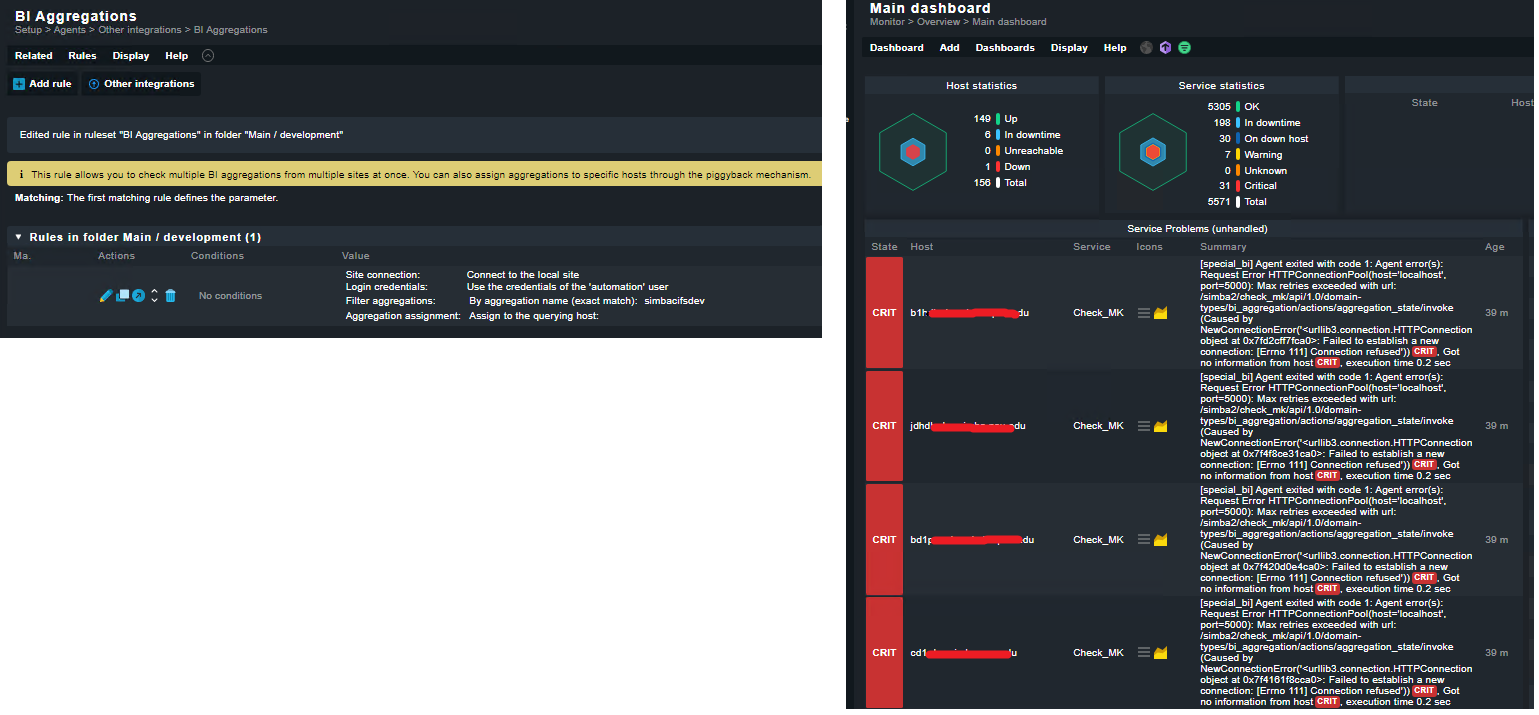
Test 2: Aggregation assignment: “Assign to the query host:” See screenshots bi003.png
Test 3: Aggregation assignment: “Assign to the affected hosts:” See screenshots bi005.png
ok, so it looks like your automation user isn’t setup correctly, but your grafana_user seems to work, so let’s not tackle this problem right now.
I would suggest to go with “assign to the query host” BUT also limit the host in the conditions to just one host, otherwise the BI gets queried multiple times, but you only need it once. As the query host, I would suggest you use either a) a dummy host that has no other checks or b) the host, that actually
provides the filesystem that is mounted as a CIFS share. (i.e. a windows dfs host, netapp, linux samba host, whatever is providing the CIFS fs.)
bi005.png says it couldn’t find the aggregation - is the aggregation named exactly “simbacifsdev”? and does the grafana_user have the permission to view all aggregations?
Thanks Gerd!
Major progress. Behaving as expected now. Only the actually service in the aggregation that goes down appears on the dashboard now.
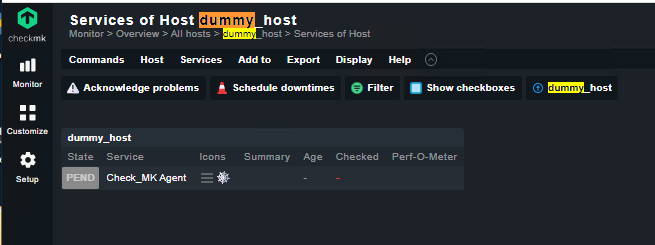
By the way, I created a dummy_host with IP 0.0.0.0 and set the “Checkmk agent / API integration” to “No API integration, no Checkmk agent”. I then set “Host Check Command” to “Always assume host to be up”. (hope that is the best way to set it up).
So my outstanding issue is actually sending notification. Not sure how to configure the notification event. I have tried creating a notification event with the “Match Hosts” set to the dummy_host and “match service event” but I don’t get any notification emails. Please see screenshots bi006.png and bi007.png. Thanks.
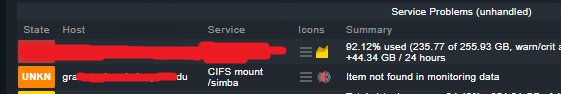
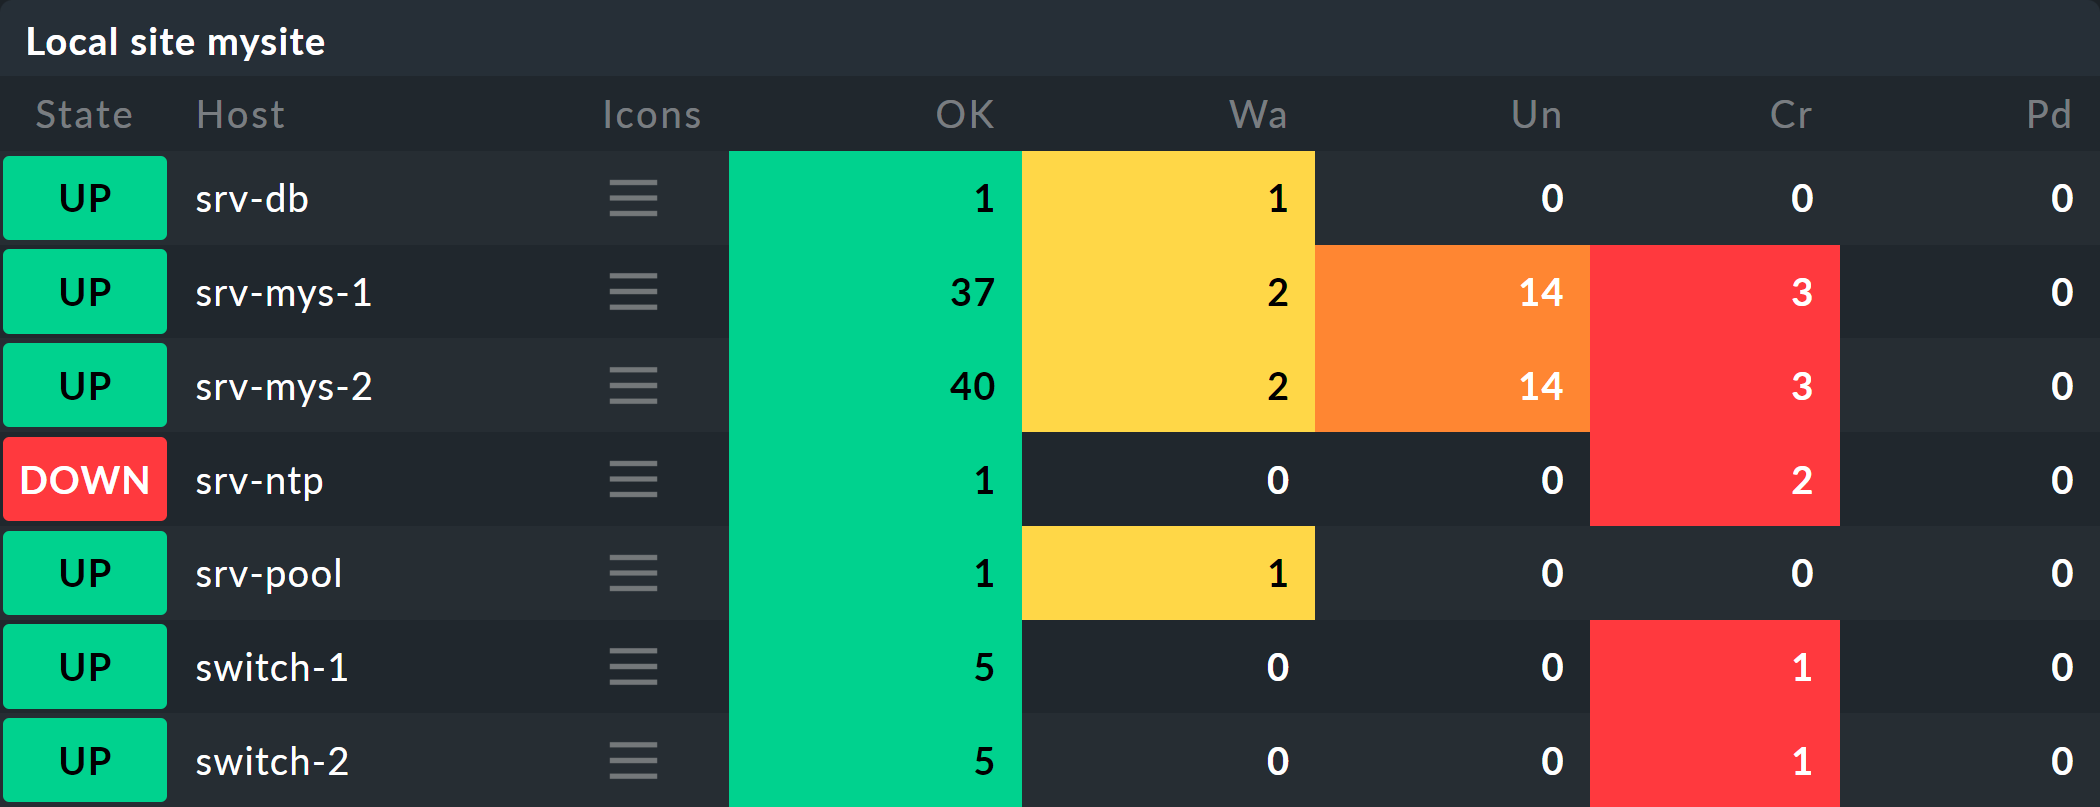
Concrete example, /simba CIFS share on host1 is one of the aggregated services assigned to dummy_host. If I manually unmount /apps on host1, host1 with service /simba
appear on the main dashboard with unknown status. I had assumed it would be dummy_host that will appear on the dashboard? Remember I have turned off notifications for all the individual aggregated services. Thanks.
services only not show up on the dashboard if they are in downtime. Or if you change your dashboard filters to also ignore services with “notifications disabled”.
What is weird though is, that your dummy_host didn’t show up.
Is the aggregation shown on the dummy host?
Does your aggregation change the state accordingly and go to “unknown” or is it maybe using the “best” state of all mounts and hence stays “ok”?
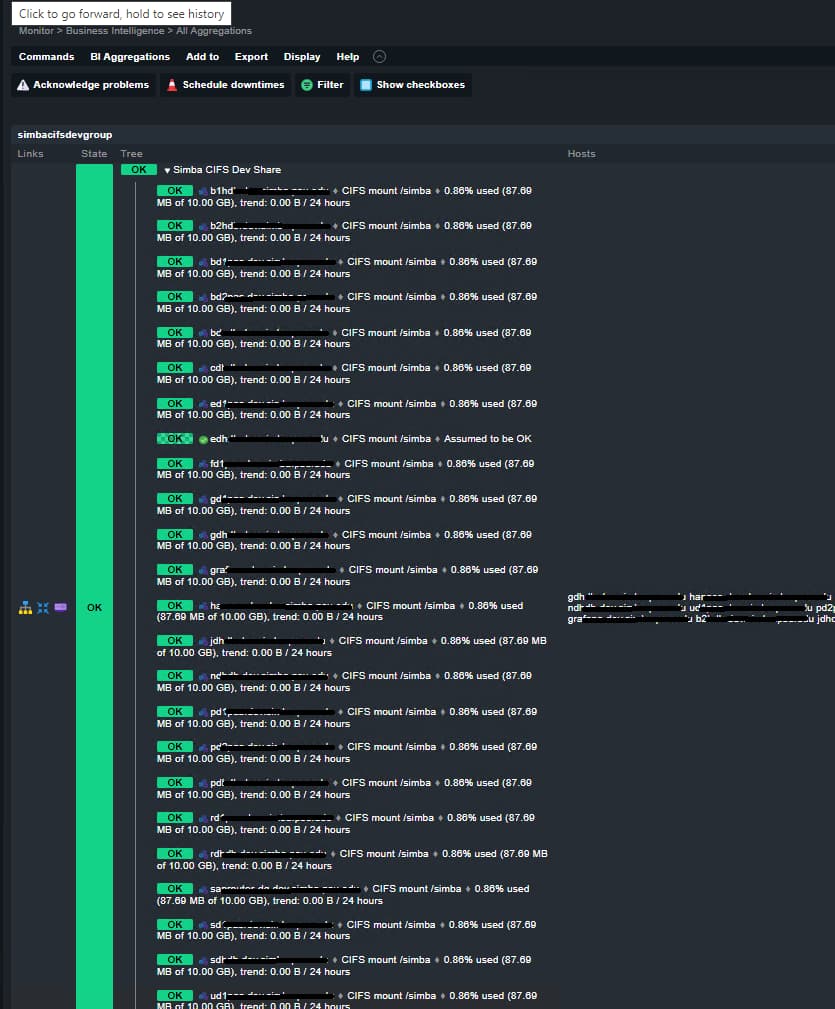
When I use the “Fake Check results” on the CIFS share on a specific host, it shows the actual host/service on the dashboard instead of the dummy_host. Though the state of the aggregation changes as expected in “Monitor > Business Intelligence” > All Aggregation"
Also, this screenshot in the documentation ( Business Intelligence (BI) - Reduce complexity with BI ), I have not been able to find how/where in the UI it was taken to try and see if I would see my dummy_host there:
I am also using the “Worst - take worst of all node status” and testing it shows it works as expected in the “Monitor > BI > All Aggregations” dashboard.
let’s take this one step at a time
→ can you show the rule assigning the BI Aggr to your dummy_host?
→ can you share a screenshot of your dummy_host showing the Service with the BI State?
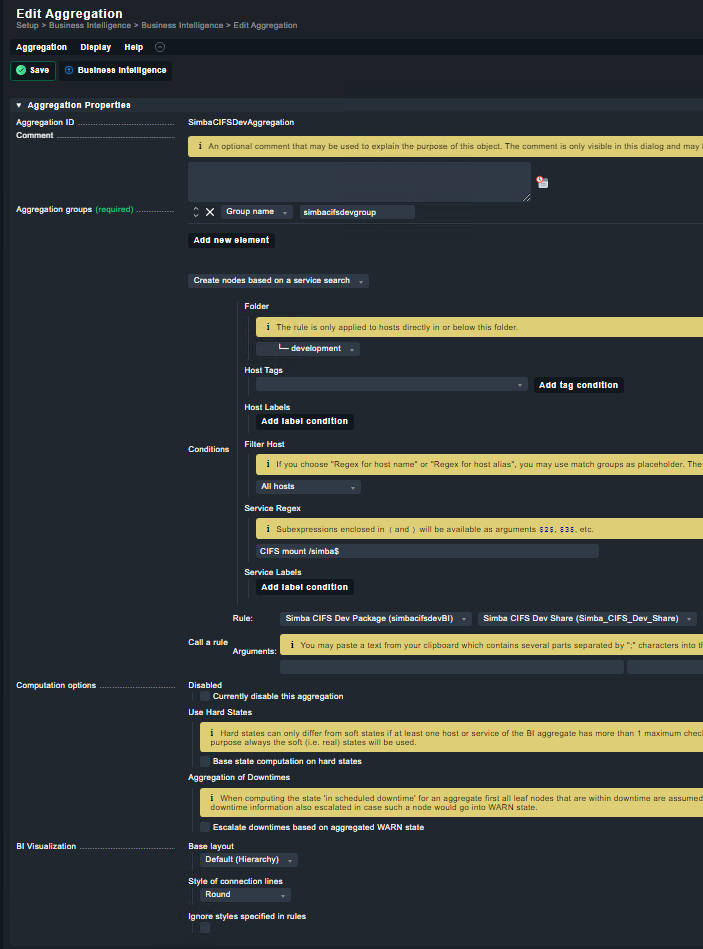
Thanks. I have captured all the relevant configuration (pages) from my set up are attached.
A few things I noticed:
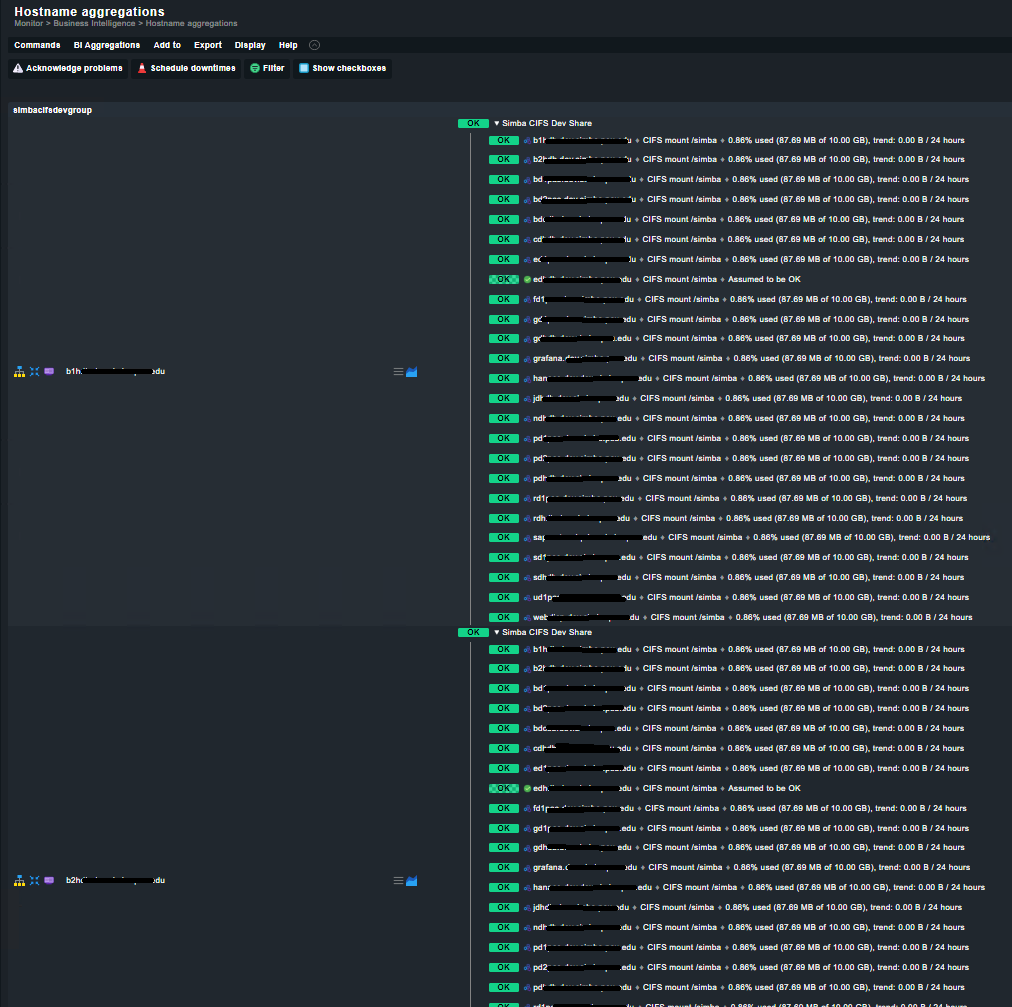
My regex in the BI rule matches all the relevant 25x hosts with the same service/share but when I go to “Monitor > BI > Hostname aggregations” I expected to find just one entry with dummy_host on the left and the 25x hosts attached to it, BUT instead I find one entry for every of the 25 hosts on the left and for every entry, the 25 hosts are attached to it (bia07.png)?
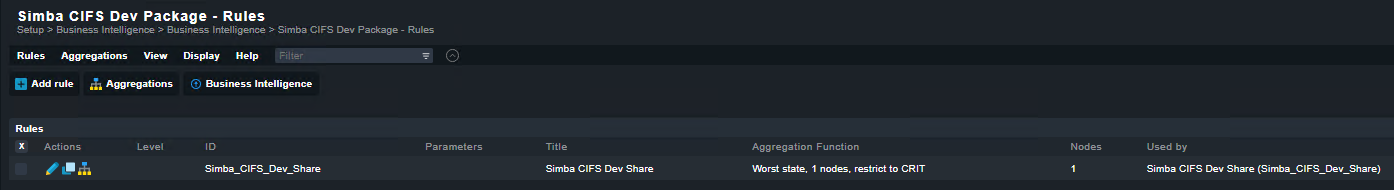
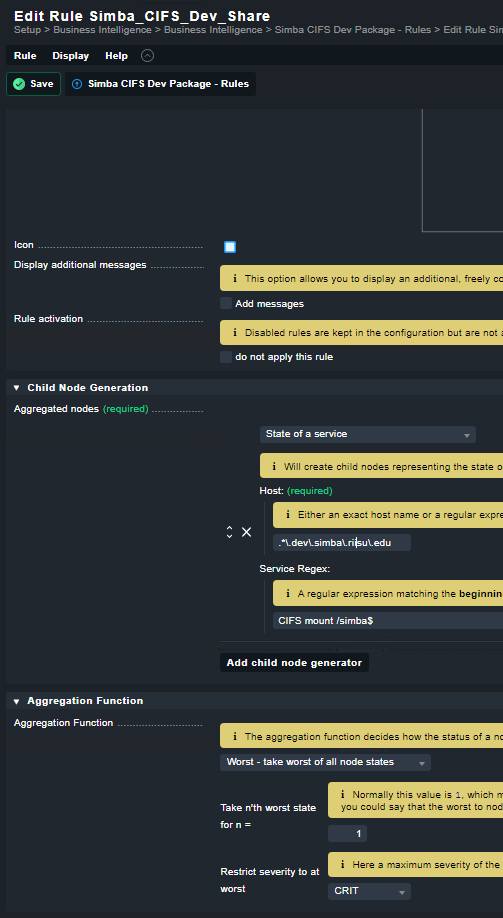
I am wondering if the issue is with my aggregate config (bia08.png) or the BI rule (bia03.png)?