I recently created a new BI aggregation wich tracks the state of 2 or more specific services on a host for a wide range of hosts. All is working as intended.
But as this aggregation checks about 400 hosts, of which most are in an OK state, it’s quite tricky to scroll through the visualization to find the hosts which are not OK.
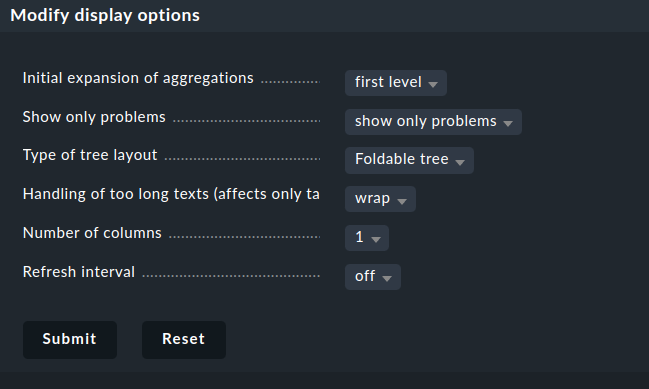
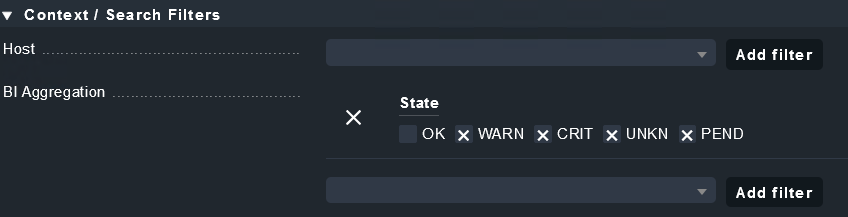
Is there a way to exclude aggregation nodes with a certain state (here OK) from the visualization?
This topic was automatically closed 365 days after the last reply. New replies are no longer allowed. Contact an admin if you think this should be re-opened.