Hello,
I have a problem with the new checkmk Datasource on Grafana when the value is “0”.
I didn’t have this problem with PNPNagios.
- Context:
Check_mk 2.0.0p11 RAW with pnpnagios and check_mk database
Check_mk 2.0.0p15 RAW with check_mk database
Grafana v8.2.3
- Test protocol:
I use manual script with 2 case, value=0 or value=42 (/usr/lib/check_mk_agent/local)
# ./test_bug_check_mk.sh
0 Test_Bug status=0 test with 0

# ./test_bug_check_mk.sh
42 Test_Bug status=42 test with 42
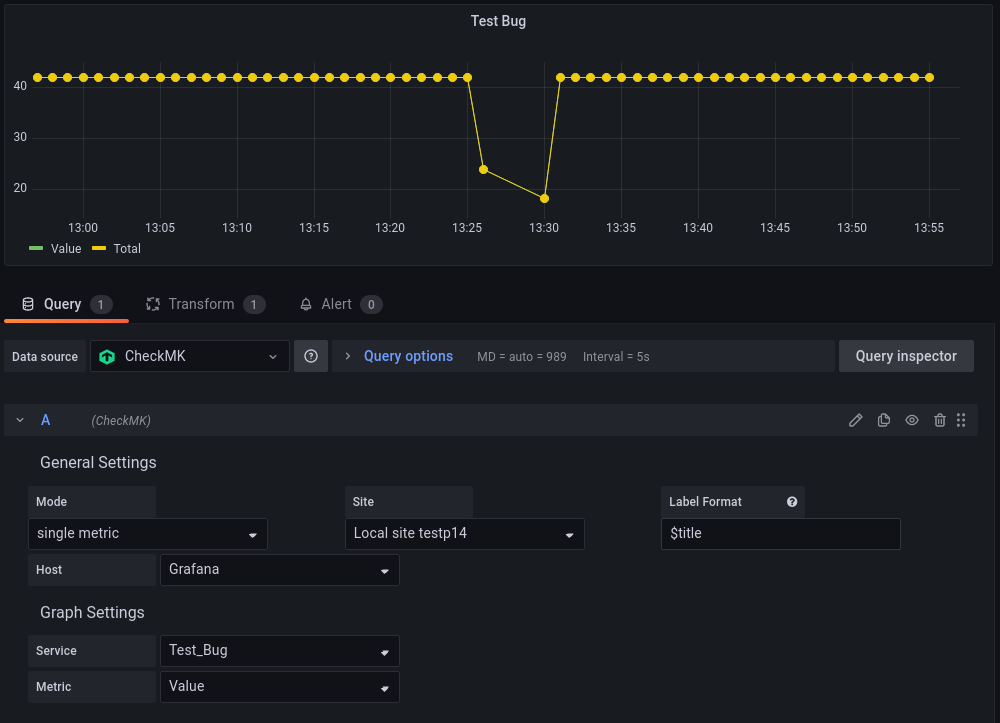
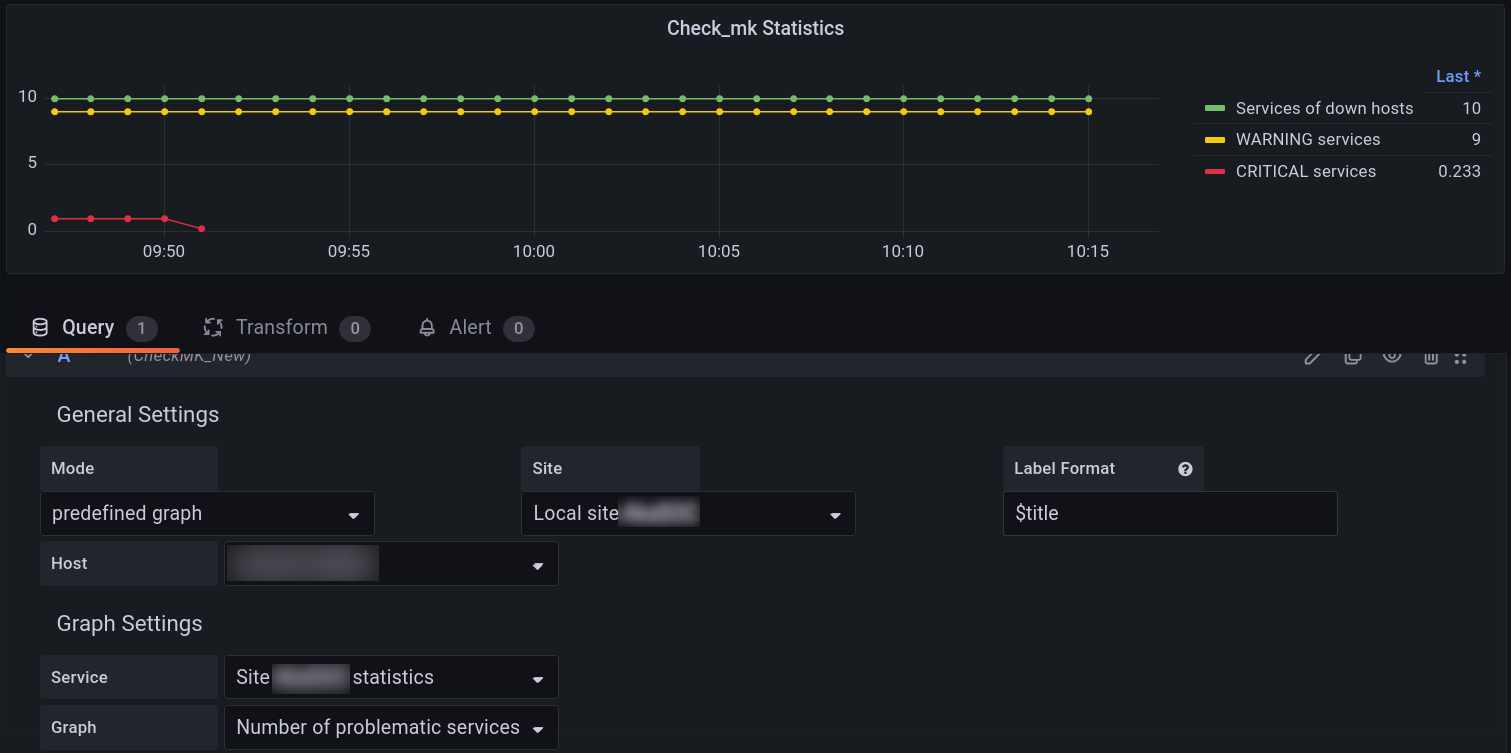
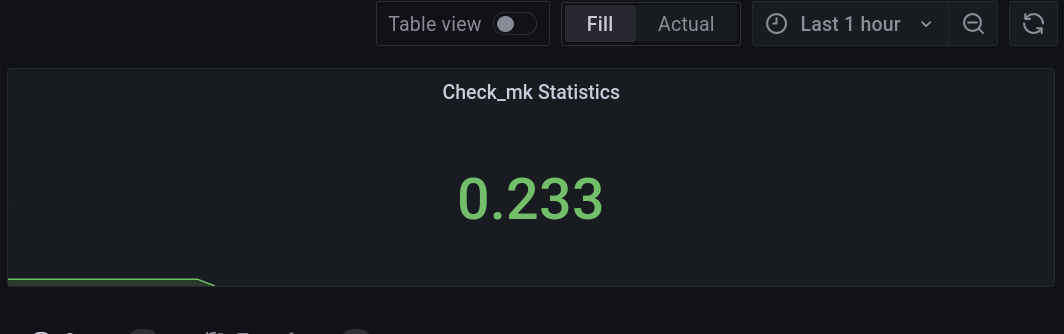
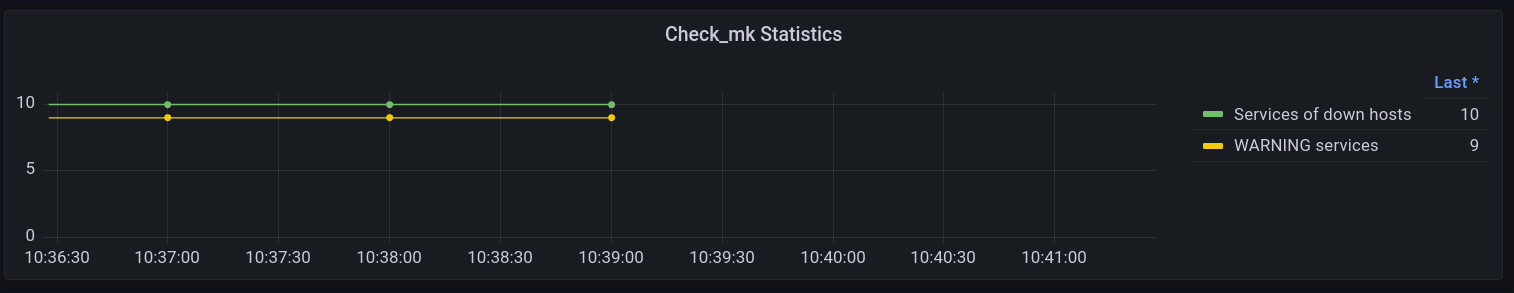
- On check_mk, it’s ok:
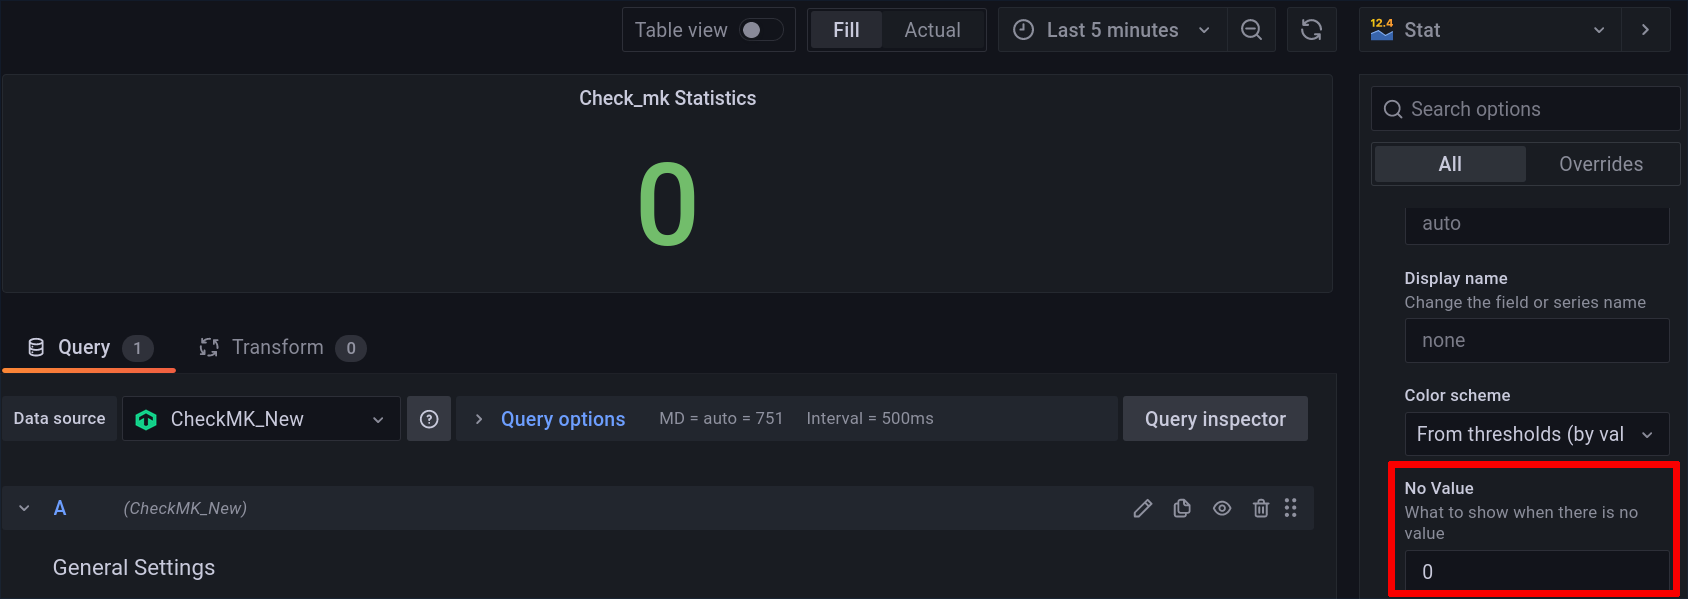
- But on Grafana with Check_mk Datasource the 0 values are ignored, we don’t see check point:

So it’s a problem for me because, i usually use the 0 as referential on custom script.
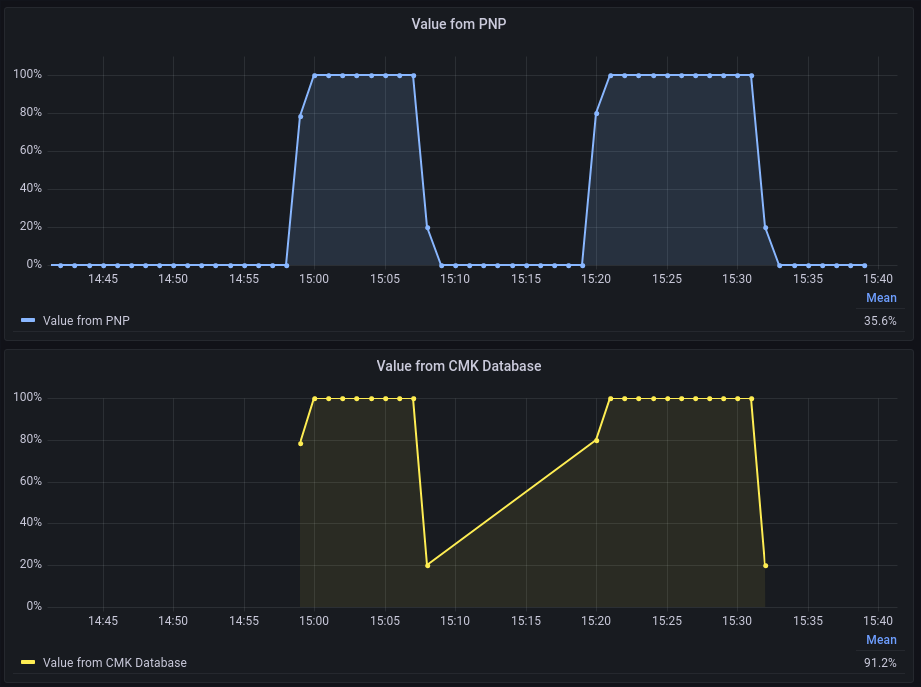
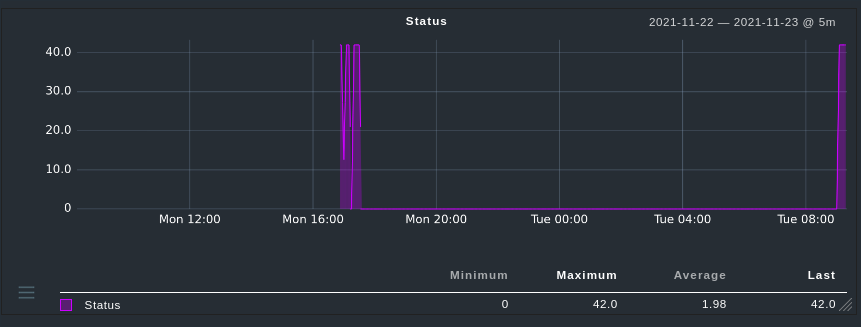
- An other exemple with SLA :

When the service is Down, we have the 0 Value on check_mk.
-
With PNPNagios we have the 0 (2.0.0p11) :
-
But with Checkmk Database we have not the 0 !
-
So if I want to see the SLA, I have good value with pnpnagios :
-
But wrong value with checkmk database
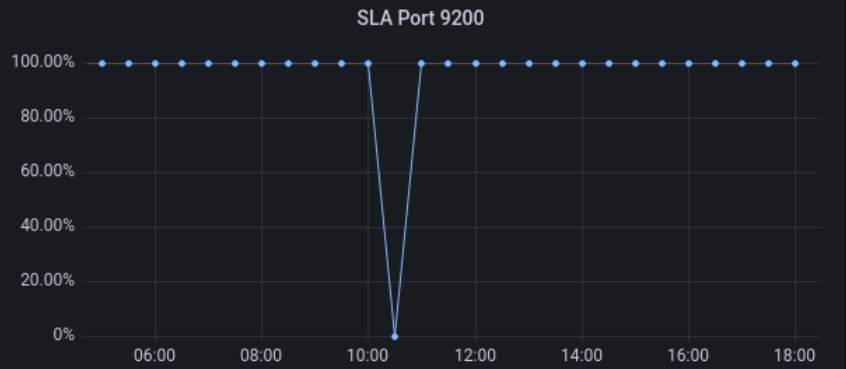


Obviously, he cannot calculate because the zero is ignored.
I think the problem exist because on Grafana, the checkmk database have not the option “Fill” (as InfluxDB, pnpNagios…)
Usually with “Fill” we can choose “Zero, Null, Fill…”
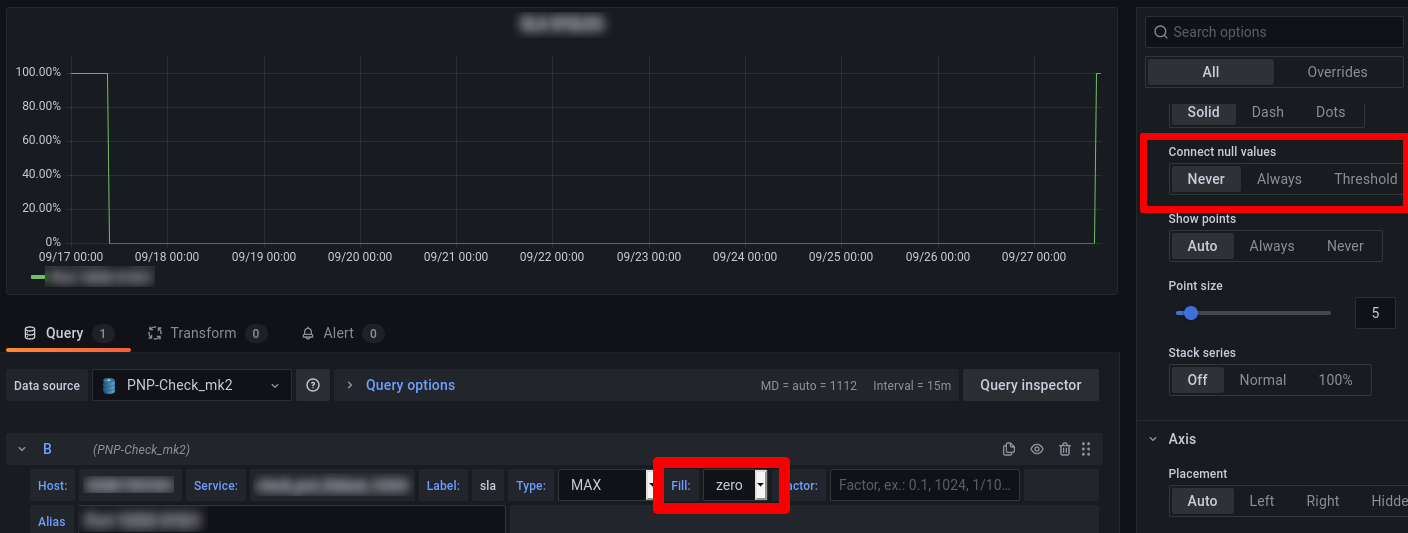
- Exemple with Pnp Nagios:
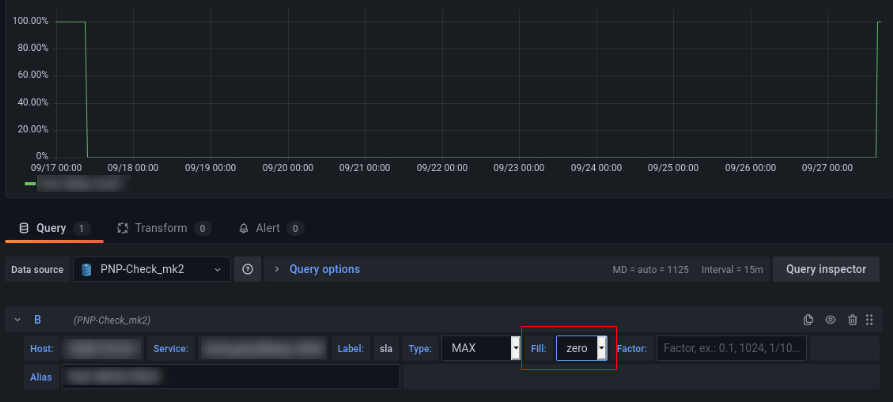
As you see with PNPnagios and fill:Zero, the 0 value appear.
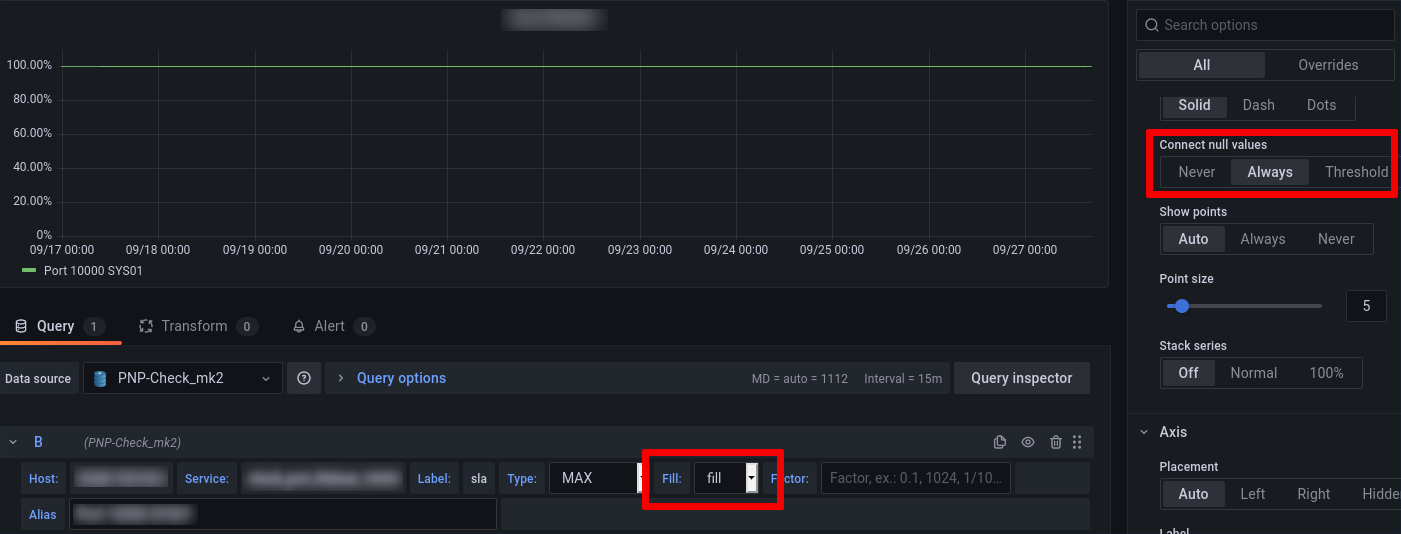
- Now the same with Fill:fill:
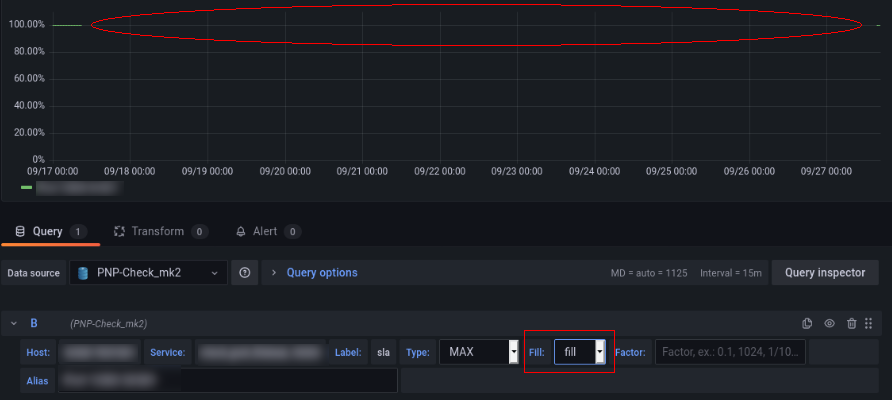
And now, I have not 0 value, and If I select “Connect null values” I would get a continuous line.
Do conclude, with PNPnagios, the graphic are the same on Check_mk and Grafana, but with Check_mk Datasource plugin, when the value is 0 we have not the same graphic.
So, do you have a tricks for that ? Or an update planned ?
Thank you for reading.
Regard.