BUG: No graphs in 2.0.0p2 RAW for services with spaces in description

Hi all,

This morning I did an upgrade from 1.6.0p20 to 2.0.0p2.
I upgraded the master and the slave and then started both.
I think it went smooth.
Most things seems to work.
Monitoring and alert are still fonctionnal.

My problem is with the graph. I have some “categorie” of graph that works (ping/check_mk/memory/uptime) All the other graph don’t work and tell me this :
No historic metrics recorded but performance data is available. Maybe performance data processing is disabled.

Anyone has an idea of where I could look to fix this?

On that same instance where I did the upgrade. I juste created a new monitoring and added my first host to it to test.
I have the same behavior.

Hi,

same problem here…

BR Gerald

Error found I think :slight_smile:
It was this commit Read metric names from XML file (was filenames) · tribe29/checkmk@f01c463 · GitHub
It changed the finding of names for the metrics from the file name to the XML file.
What is very interesting is the following - at the moment only service without space inside the description are working. Why? The function cannot find an metric for services with spaces as these spaces are replaced inside the XML file and the filename.
On the first look i see no replacing of space with underscore in this commit.

How can something like this go into production? Like, this takes a minute to test basically even on a brand new instance, new everything…

I updated from 2.0.0p1 to p2 and considering to downgrade now, unless we can just fix it by changing that file to the old one on github?

Edit: just noticed this isn’t a Python file but rather a C file, so not as easy.

There is an easy workaround.
The livestatus module must be replaced with the livestatus from p1.

/omd/versions/2.0.0p1.cre/lib/mk-livestatus/livestatus.o
to
/omd/versions/2.0.0p2.cre/lib/mk-livestatus/livestatus.o

Restart the monitoring core - graphs again available

2 Likes

:+1: :+1: :+1: you saved my day

This does not seem to be just in RAW. I am expiriencing the same on CEE. All graphs for services with spaces in their name are gone. I.e. “CPU load”, “CPU utilization” etc. Whereas “Memory” and “Uptime” still show.
My upgrade took place from 2.0.0p1 to 2.0.0p2.

Where are your rrd files stored? Was it before sometime a RAW edition and the RRD’s stored inside ~/var/pnp4nagios/perfdata?

But good news is the problem is already in processing by devs.

1 Like

You are right!
I used to have RAW and my perfdata is indeed at ~/var/pnp4nagios/perfdata

Ok then the problem is as I expected also the incorrect conversion of the service description to filenames.
The workaround should also do the trick in your environment i hope :slight_smile:

will be fixed with werk #12298

This resolved my issue as well! Thanks! :+1: :slight_smile:

mit werk #12298 wird der beschriebene fehler in livestatus.o behoben.

allerdings gibt es wohl auch bei anderen zeichenersetzungen probleme und die meldung lautet nun:

Cannot create graph

Cannot get RRD data for sensors.chaos.inc/sensor:tf:mmlx:light:ext/lux_ext

was wohl an der falschen ersetzung des zeichens “:” liegt. im dateisystem wird mit “_” ersetzt.

vlt. wird das ja irgendwann auch gefixt.

danke und gruß
kohly

Es gibt noch einen weiteren Commit zu diesem Problem.

kann sein, dass damit auch dieses Problem weg ist - dort wird jedenfalls ein “pnp_cleanup” gemacht was eigentlich alle Zeichen welche nicht so gespeichert werden können durch “_” ersetzen sollte.

der fehler (“Cannot create graph …”) ist in 2.0.0p3 noch enthalten.

Hi @kohly.de, den Fehler kann ich mit der p3 nicht nachvollziehen, u.a. deswegen wollen wir die p3 ja releasen. Kannst Du das Fehlerbild bitte genauer beschreiben?

hallo gulaschcowboy,

ich habe noch etwas ausprobiert und komme zu folgendem:

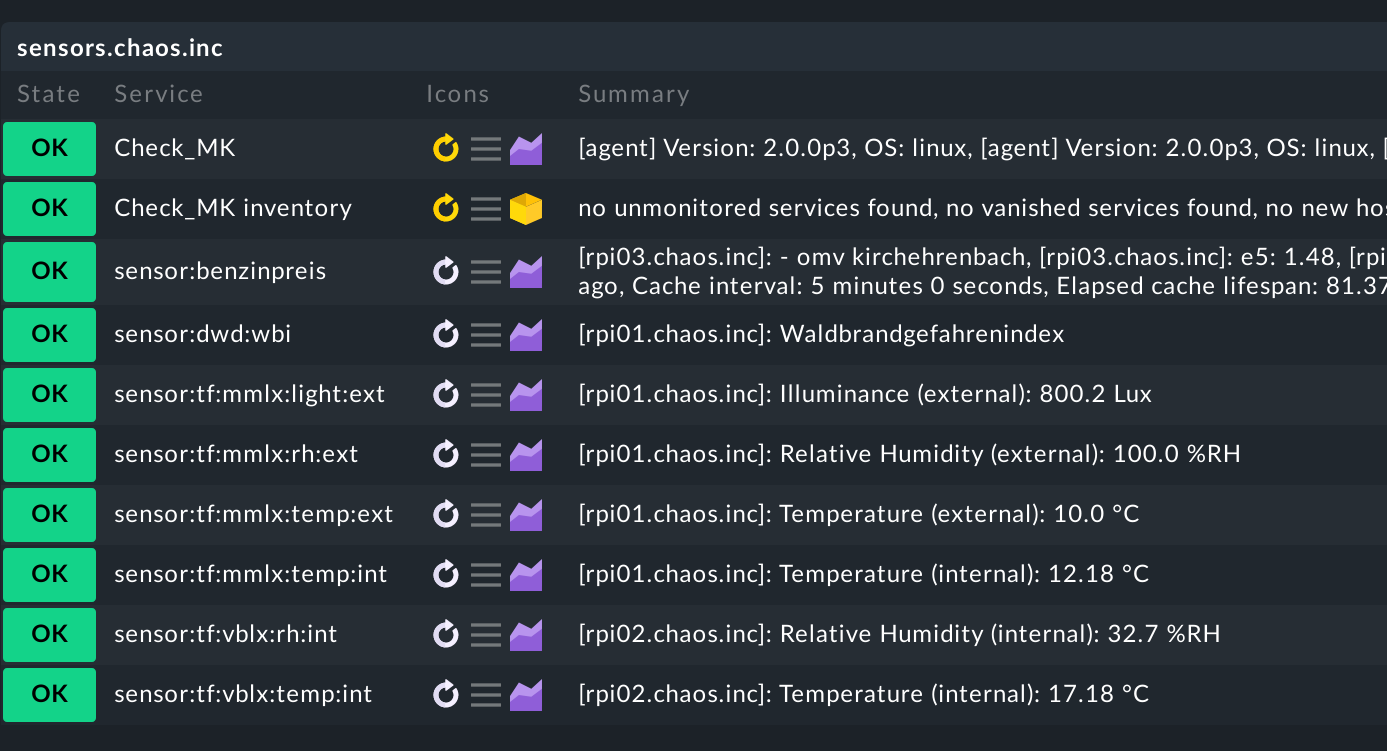
auf rpi0[123].chaos.inc (clusternodes) liegen jeweils local checks, die ich unter ‘sensor.chaos.inc’ als clustered services (sensor:.*) zusammen gefasst habe.
diese checks an sich werden nach wie vor korrekt angezeigt


seit v2 allerdings nicht mehr alle graphen.

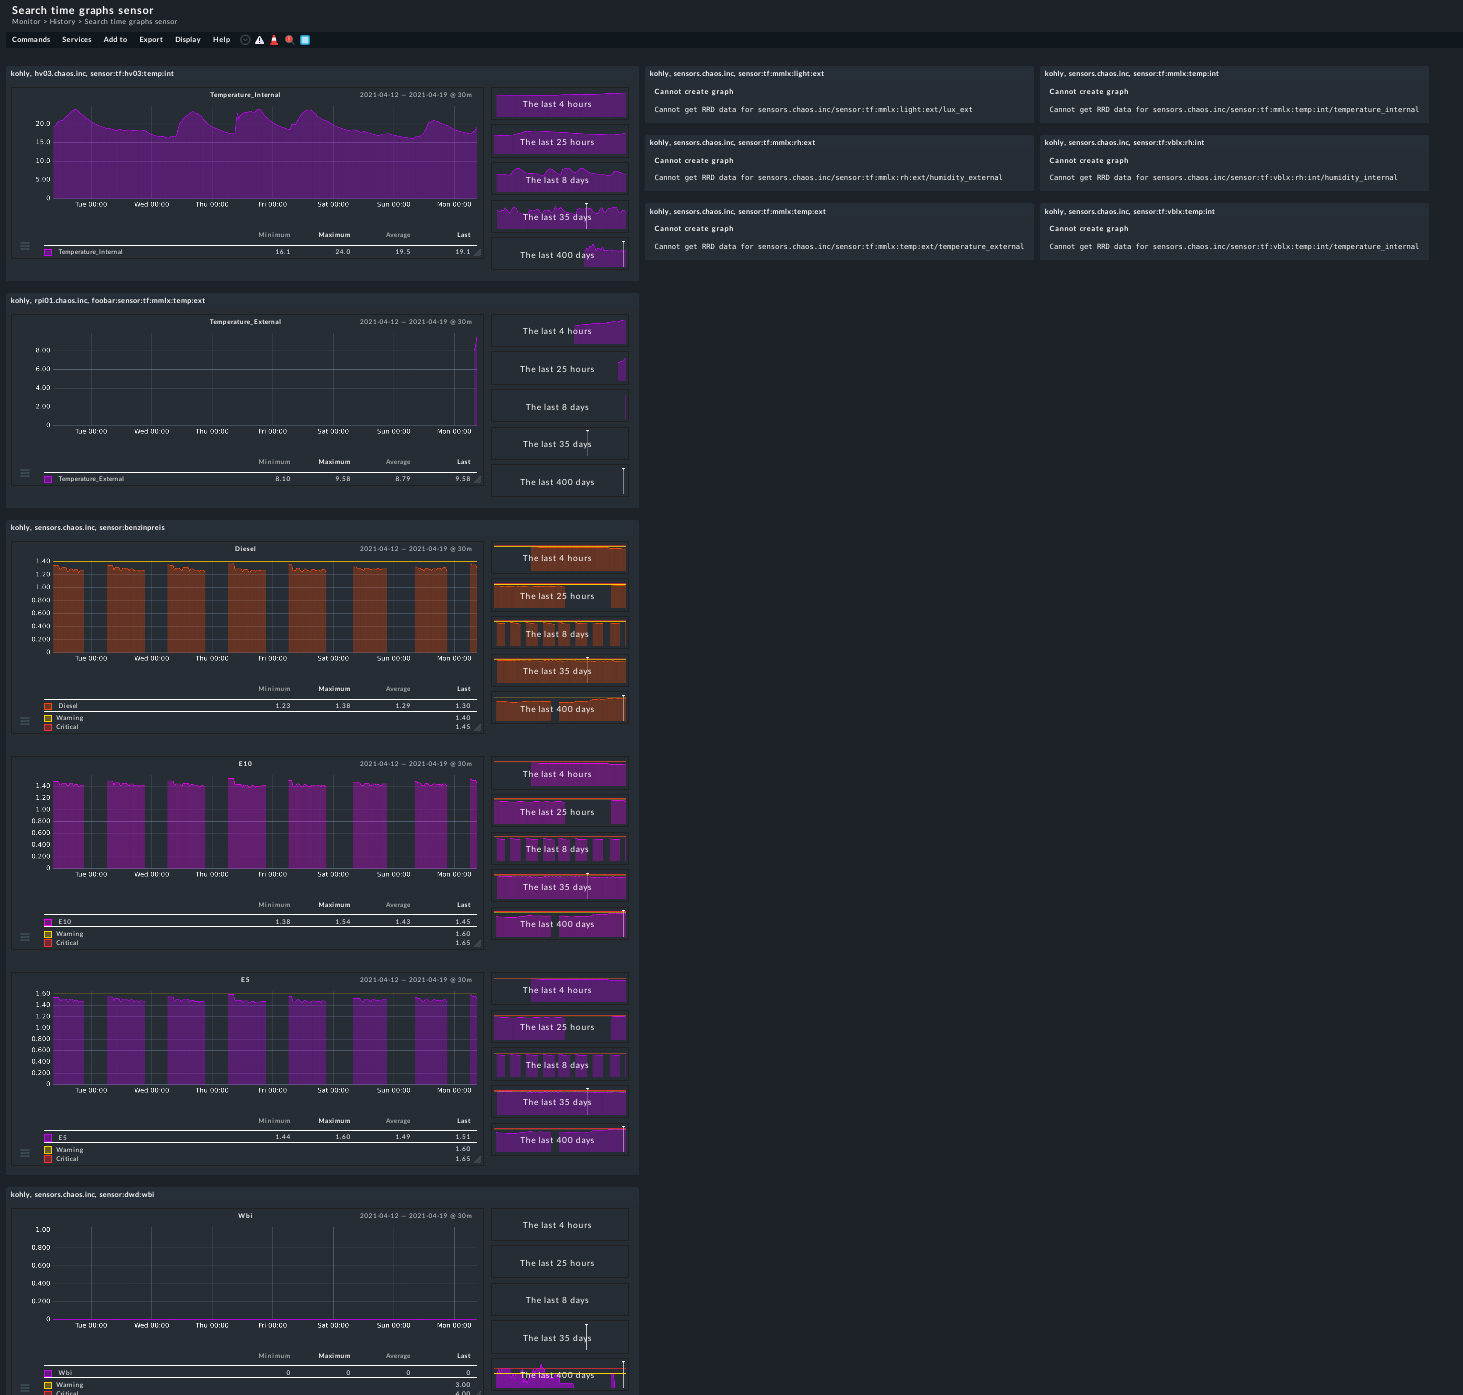
alle ‘sensor:tf:.*’ graphen erzeugen die fehlermeldung ‘Cannot create graph’.
seltsamerweise aber ‘…benzinpreis’ und ‘…wbi’ nicht.

zum test habe ich auf ‘rpi01’ ein script kopiert und dem servicenamen ‘foobar:’ vorangestellt.
dieser ‘extracheck’ ist nicht als clusterservice definiert und erscheint direkt beim host rpi01.
dort wird der graph angezeigt, ebenso bei hv03, der nicht dem cluster angehört.
vgl. screenshot

danke und vg
kohly

gerade finde ich (vlt. hat es ja damit zu tun):

==> var/log/livestatus.log <==
2021-04-19 09:32:57 [client 1] Error flushing RRD: Flushing of file “/omd/sites/kohly/var/pnp4nagios/perfdata/sensors.chaos.inc/sensor_tf_mmlx_temp_ext_temperature_external.rrd” failed: rrdcached@/omd/sites/kohly/tmp/run/rrdcached.sock: No such file: /opt/omd/sites/kohly/var/pnp4nagios/perfdata/sensors.chaos.inc/sensor_tf_mmlx_temp_ext_temperature_external.rrd… Skipping remaining 0 files.
2021-04-19 09:32:57 [client 1] Error accessing RRD: opening ‘/omd/sites/kohly/var/pnp4nagios/perfdata/sensors.chaos.inc/sensor_tf_mmlx_temp_ext_temperature_external.rrd’: No such file or directory
2021-04-19 09:32:57 [client 6] Error flushing RRD: Flushing of file “/omd/sites/kohly/var/pnp4nagios/perfdata/sensors.chaos.inc/sensor_tf_mmlx_temp_int_temperature_internal.rrd” failed: rrdcached@/omd/sites/kohly/tmp/run/rrdcached.sock: No such file: /opt/omd/sites/kohly/var/pnp4nagios/perfdata/sensors.chaos.inc/sensor_tf_mmlx_temp_int_temperature_internal.rrd… Skipping remaining 0 files.
2021-04-19 09:32:57 [client 6] Error accessing RRD: opening ‘/omd/sites/kohly/var/pnp4nagios/perfdata/sensors.chaos.inc/sensor_tf_mmlx_temp_int_temperature_internal.rrd’: No such file or directory
2021-04-19 09:32:57 [client 12] Error flushing RRD: Flushing of file “/omd/sites/kohly/var/pnp4nagios/perfdata/sensors.chaos.inc/sensor_tf_mmlx_rh_ext_humidity_external.rrd” failed: rrdcached@/omd/sites/kohly/tmp/run/rrdcached.sock: No such file: /opt/omd/sites/kohly/var/pnp4nagios/perfdata/sensors.chaos.inc/sensor_tf_mmlx_rh_ext_humidity_external.rrd… Skipping remaining 0 files.
2021-04-19 09:32:57 [client 12] Error accessing RRD: opening ‘/omd/sites/kohly/var/pnp4nagios/perfdata/sensors.chaos.inc/sensor_tf_mmlx_rh_ext_humidity_external.rrd’: No such file or directory

irgend etwas stimmt bei der umsetzung der dateinamen nicht.
vlt. die sind die vielen ‘:’ im namen die ursache?

gruß
kohly

Die Fehlermeldung würde erstmal erklären warum kein Graph gezeichnet werden kann.
Wenn ich die Dateinamen aus deinem anderen Post mir anschaue dann fällt mir auf was das Problem ist.

Dateinamen auf der Platte

var/pnp4nagios/perfdata/sensors.chaos.inc/sensor_tf_mmlx_temp_ext.rrd
var/pnp4nagios/perfdata/sensors.chaos.inc/sensor_tf_mmlx_temp_ext.xml

Und hier die Datei welche versucht wurde zu benutzen/laden

var/pnp4nagios/perfdata/sensors.chaos.inc/sensor_tf_mmlx_temp_ext_temperature_external.rrd

Das “temperatur_external” wurde hier von CMK noch angehängt.