I recently updated our Check_MK instance from 1.6.x to 2.0.0. Since the update we are having trouble with the metric units in our graphs. But weirdly only for bandwith values that come from SNMP checks.
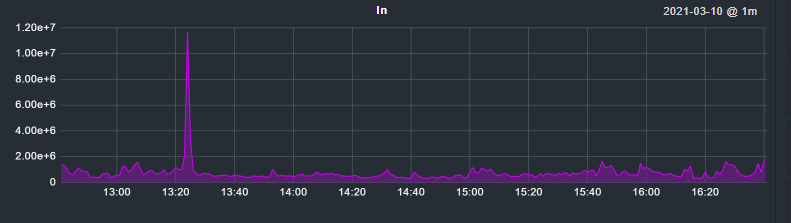
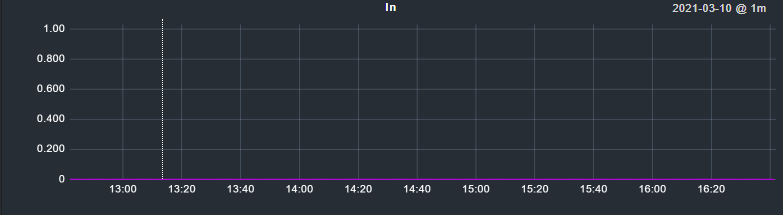
I will posts pictures as soon as I am at home. e.g. bandwiths on an interface from our firewall will be displayed as 1.25e+7 or from a switch will be display as values from 0.00 to 1.00.
But these effects only occur when taking a look at the graphs. The values displayed within the host overview view are correct. Any ideas?
Cheers!
Edit: Pictures added. As the forum only allows me to upload one image per post. Ich will add three separate posts for the images…
I guess this is a behavior related to how the value is reported via SNMP. If you check the raw data (agent output directly or in the service view row Service performance data) I assume your firewall is returning the values in bytes and therefor you have the exponential axis in your graphs.
At the switch it my be kB or MB returned by SNMP which causes the graph to show other ranges the fit the values.
I guess this is a behavior related to how the value is reported via SNMP. If you check the raw data (agent output directly or in the service view row Service performance data ) I assume your firewall is returning the values in bytes and therefor you have the exponential axis in your graphs.
You might be right, but the values were correctly displayed before I updated to 2.0.0. So I think SMNP issues could be ruled out? Unfortunately I was not able to find an option to change the units. I checked other firewall hosts, and they are showing the same strange behavior…
The raw SNMP shows the values returned in Bit. The same as prior to the update.
At the switch it my be kB or MB returned by SNMP which causes the graph to show other ranges the fit the values.
I deleted the Switch host and added it again. And this seemed to fix the problem. I’ve tried the same procedure for the firewalls, but with no effect.
Question from my side - is this the “interface” check and not the “if64” or “if” check?
It looks like a very strange problem with the new “interface” check. Sometimes it is working sometimes not.
I found the issue, I’ll fix it today. The translation is missing for the “interfaces” plugin in cmk/gui/plugins/metrics/translation.py.
FYI: Next patchrelease will be probably this week.
This topic was automatically closed 365 days after the last reply. New replies are no longer allowed. Contact an admin if you think this should be re-opened.